
PUBLISHER: Global Market Insights Inc. | PRODUCT CODE: 1698530

PUBLISHER: Global Market Insights Inc. | PRODUCT CODE: 1698530
Voluntary Carbon Credit Market Opportunity, Growth Drivers, Industry Trend Analysis, and Forecast 2025-2034
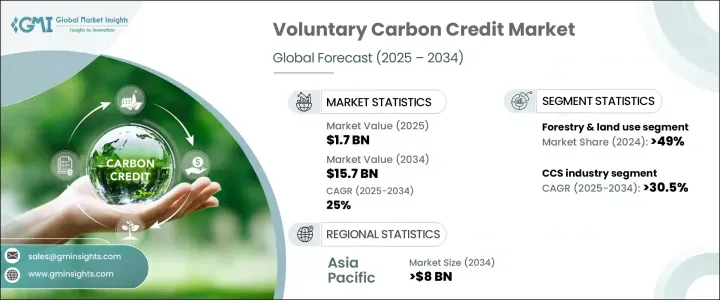
The Global Voluntary Carbon Credit Market, valued at USD 1.7 billion in 2024, is projected to expand at a CAGR of 25% from 2025 to 2034. Growing corporate commitments to achieving net-zero emissions and improving sustainability ratings have driven the development of diverse credit systems across different sectors. Companies are actively purchasing carbon credits to offset emissions from business operations, reinforcing market growth. The integration of voluntary carbon credits into compliance frameworks has enhanced market liquidity, credibility, and demand, attracting institutional investors who contribute to price stability and corporate participation. This integration is facilitating increased investment in high-quality projects, boosting global efforts to reduce carbon footprints, and accelerating the industry's expansion.
A significant number of enterprises now incorporate carbon credits into their ESG strategies to strengthen investor confidence and enhance business reputations. While the voluntary carbon credit market saw a decline from USD 1.9 billion in 2022 to USD 1.7 billion in 2024, industry projections indicate a strong rebound driven by technological advancements and improved methods for calculating carbon offsets. Innovations that improve accessibility and traceability are expected to support sustained growth over the forecast period.
| Market Scope | |
|---|---|
| Start Year | 2024 |
| Forecast Year | 2025-2034 |
| Start Value | $1.7 Billion |
| Forecast Value | $15.7 Billion |
| CAGR | 25% |
Several frameworks worldwide encourage businesses to voluntarily offset emissions and align with sustainability objectives. These guidelines emphasize accountability and transparency, prompting more organizations to engage in carbon credit markets. Additionally, various approaches outside government regulations are promoting voluntary participation in emissions reduction programs, expanding the market's scope.
The market is categorized into multiple segments based on end use, including forestry and land use, agriculture, renewable energy, carbon capture and storage, household and community, chemical processes, industrial and commercial, transportation, and waste management. In 2024, forestry and land use accounted for more than 49% of the market share, with expectations of continued growth. Expanding afforestation and reforestation projects worldwide have increased the demand for carbon offsets, with environmental policies further reinforcing these initiatives.
The carbon capture and storage sector within the voluntary carbon credit market is anticipated to grow at a CAGR exceeding 30.5% through 2034. Rising investments in carbon mitigation and advancements in storage technologies are key factors fueling this expansion. The renewable energy sector is also expected to surpass USD 3 billion by 2034, driven by the growing share of renewable sources in national energy portfolios. As the global energy mix shifts toward sustainable alternatives, the demand for carbon credits is expected to rise significantly.
In the United States, the voluntary carbon credit market grew from USD 200 million in 2022 to USD 400 million in 2024. Increasing net-zero commitments and consumer preference for sustainable products are driving corporate adoption of carbon credit programs. Enhanced transparency in carbon credit trading, supported by blockchain technology, has strengthened trust in the market. Additionally, investments in direct air capture and carbon removal initiatives are fostering innovation, further supporting the voluntary carbon credit industry's growth.
Table of Contents
Chapter 1 Methodology & Scope
- 1.1 Market scope & definitions
- 1.2 Market estimates & forecast parameters
- 1.3 Forecast calculation
- 1.4 Data sources
- 1.4.1 Primary
- 1.4.2 Secondary
- 1.4.2.1 Paid
- 1.4.2.2 Public
Chapter 2 Executive Summary
- 2.1 Industry synopsis, 2021 - 2034
Chapter 3 Industry Insights
- 3.1 Industry ecosystem analysis
- 3.2 Regulatory landscape
- 3.3 Industry impact forces
- 3.3.1 Growth drivers
- 3.3.2 Industry pitfalls & challenges
- 3.4 Growth potential analysis
- 3.5 Porter's analysis
- 3.5.1 Bargaining power of suppliers
- 3.5.2 Bargaining power of buyers
- 3.5.3 Threat of new entrants
- 3.5.4 Threat of substitutes
- 3.6 PESTEL analysis
Chapter 4 Competitive Landscape, 2024
- 4.1 Introduction
- 4.2 Strategic outlook
- 4.3 Innovation & sustainability landscape
Chapter 5 Market Size and Forecast, By End Use, 2021 – 2034 (Million Credits, USD Billion)
- 5.1 Key trends
- 5.2 Agriculture
- 5.3 Carbon capture & storage
- 5.4 Chemical process
- 5.5 Household & community
- 5.6 Industrial & commercial
- 5.7 Forestry & land use
- 5.8 Renewable energy
- 5.9 Waste management
- 5.10 Others
Chapter 6 Market Size and Forecast, By Region, 2021 – 2034 (Million Credits, USD Billion)
- 6.1 Key trends
- 6.2 North America
- 6.2.1 U.S.
- 6.2.2 Canada
- 6.2.3 Mexico
- 6.3 Europe
- 6.3.1 Bulgaria
- 6.3.2 Romania
- 6.3.3 Netherlands
- 6.3.4 Switzerland
- 6.4 Asia Pacific
- 6.4.1 China
- 6.4.2 India
- 6.4.3 Indonesia
- 6.4.4 Thailand
- 6.5 Middle East & Africa
- 6.5.1 Turkey
- 6.5.2 Kenya
- 6.5.3 Nigeria
- 6.5.4 South Africa
- 6.6 Latin America
- 6.6.1 Brazil
- 6.6.2 Chile
- 6.6.3 Peru
Chapter 7 Company Profiles
- 7.1 3Degrees
- 7.2 ALLCOT
- 7.3 Atmosfair
- 7.4 CarbonClear
- 7.5 ClimeCo
- 7.6 Climate Impact Partners
- 7.7 EcoAct
- 7.8 Ecosecurities
- 7.9 Microsoft
- 7.10 PwC
- 7.11 Shell
- 7.12 South Pole
- 7.13 TerraPass
- 7.14 The Carbon Collective Company
- 7.15 The Carbon Trust
- 7.16 VERRA

