
PUBLISHER: Global Market Insights Inc. | PRODUCT CODE: 1684842

PUBLISHER: Global Market Insights Inc. | PRODUCT CODE: 1684842
Variable Shunt Reactor Market Opportunity, Growth Drivers, Industry Trend Analysis, and Forecast 2025 - 2034
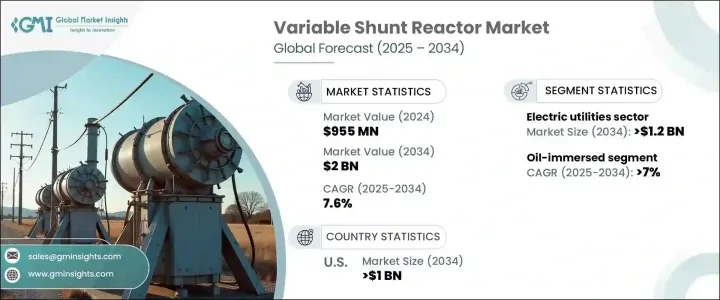
The Global Variable Shunt Reactor Market was valued at USD 955 million in 2024 and is expected to expand at a CAGR of 7.6% from 2025 to 2034. This impressive growth can be attributed to the increasing demand for grid reliability, driven by the surge in renewable energy adoption and the need for stable power systems. As urbanization and industrialization accelerate, the need for robust transmission and distribution (T&D) networks is paramount, and VSRs are crucial to maintaining voltage stability and ensuring high-quality power supply. With the ongoing expansion of power grids to meet the rising demand for electricity and the integration of renewable energy sources, the market for VSRs is on a growth trajectory, underpinned by efforts to improve the efficiency and resilience of energy infrastructures worldwide.
The VSR market's growth is heavily influenced by the global push for smarter, more efficient energy management systems. Grid operators are increasingly adopting technologies that help mitigate the fluctuating nature of renewable energy generation. Variable renewable sources like wind and solar can cause voltage fluctuations, which VSRs efficiently manage, ensuring that the grid remains stable and reliable. As governments and utilities continue to modernize grid infrastructure and invest in smart grids, the demand for VSRs is rising. High-voltage direct current (HVDC) systems, essential for long-distance power transmission, also play a key role in enhancing the adoption of VSRs. These systems work hand-in-hand with VSRs to provide voltage control, making them essential components in the evolving energy landscape.
| Market Scope | |
|---|---|
| Start Year | 2024 |
| Forecast Year | 2025-2034 |
| Start Value | $955 Million |
| Forecast Value | $2 Billion |
| CAGR | 7.6% |
The electric utilities segment is forecasted to generate USD 1.2 billion by 2034 as investments in grid modernization initiatives accelerate. The growing need for efficient voltage regulation, driven by rising electricity demand and expanding T&D networks, highlights the importance of VSRs in maintaining grid stability. Efforts to modernize energy infrastructure and facilitate a transition to smarter grids are expected to drive the widespread adoption of VSR technology.
The oil-immersed segment within the variable shunt reactor market is set to grow at a CAGR of 7% through 2034. This surge is primarily due to increasing investments in renewable energy projects and the need for effective grid stabilization solutions. As electricity consumption rises, particularly in developing regions, grid infrastructure upgrades are becoming a priority. Moreover, the growing adoption of energy-efficient technologies, including smart grids, is spurring demand for oil-immersed VSRs, which are particularly well-suited for high-voltage transmission networks.
In the U.S., the variable shunt reactor market is projected to reach USD 1 billion by 2034. This growth is driven by substantial investments in renewable energy initiatives and the expansion of high-voltage transmission networks. Additionally, the transition to smart grid technologies, alongside efforts to replace outdated grid infrastructure and enhance grid resilience, plays a crucial role in supporting the market's growth. As the U.S. continues to modernize its power grid, the demand for advanced voltage regulation solutions like VSRs will continue to rise.
Table of Contents
Chapter 1 Methodology & Scope
- 1.1 Market definitions
- 1.2 Base estimates & calculations
- 1.3 Forecast calculation
- 1.4 Data sources
- 1.4.1 Primary
- 1.4.2 Secondary
- 1.4.2.1 Paid
- 1.4.2.2 Public
Chapter 2 Executive Summary
- 2.1 Industry synopsis, 2021 - 2034
Chapter 3 Industry Insights
- 3.1 Industry ecosystem analysis
- 3.2 Regulatory landscape
- 3.3 Industry impact forces
- 3.3.1 Growth drivers
- 3.3.2 Industry pitfalls & challenges
- 3.4 Growth potential analysis
- 3.5 Porter's analysis
- 3.5.1 Bargaining power of suppliers
- 3.5.2 Bargaining power of buyers
- 3.5.3 Threat of new entrants
- 3.5.4 Threat of substitutes
- 3.6 PESTEL analysis
Chapter 4 Competitive Landscape, 2024
- 4.1 Strategic dashboard
- 4.2 Innovation & sustainability landscape
Chapter 5 Market Size and Forecast, By Phase, 2021 – 2034 (USD Million)
- 5.1 Key trends
- 5.2 Single phase
- 5.3 Three phase
Chapter 6 Market Size and Forecast, By Insulation, 2021 – 2034 (USD Million)
- 6.1 Key trends
- 6.2 Oil immersed
- 6.3 Air core
Chapter 7 Market Size and Forecast, By End Use, 2021 – 2034 (USD Million)
- 7.1 Key trends
- 7.2 Electric utility
- 7.3 Renewable energy
Chapter 8 Market Size and Forecast, By Region, 2021 – 2034 (USD Million)
- 8.1 Key trends
- 8.2 North America
- 8.2.1 U.S.
- 8.2.2 Canada
- 8.3 Europe
- 8.3.1 UK
- 8.3.2 Germany
- 8.3.3 France
- 8.3.4 Italy
- 8.3.5 Russia
- 8.4 Asia Pacific
- 8.4.1 China
- 8.4.2 India
- 8.4.3 Japan
- 8.4.4 Australia
- 8.5 Middle East & Africa
- 8.5.1 Saudi Arabia
- 8.5.2 UAE
- 8.5.3 Qatar
- 8.5.4 South Africa
- 8.6 Latin America
- 8.6.1 Brazil
- 8.6.2 Argentina
Chapter 9 Company Profiles
- 9.1 CG Power & Industrial Solutions
- 9.2 Fuji Electric
- 9.3 GBE
- 9.4 GE
- 9.5 Getra
- 9.6 Hitachi Energy
- 9.7 Hyosung Heavy Industries
- 9.8 Nissin Electric
- 9.9 SGB Smit
- 9.10 Siemens Energy
- 9.11 Shrihans Electricals
- 9.12 TMC Transformers Manufacturing Company
- 9.13 Toshiba Energy Systems & Solutions
- 9.14 WEG

