
PUBLISHER: Global Market Insights Inc. | PRODUCT CODE: 1741030

PUBLISHER: Global Market Insights Inc. | PRODUCT CODE: 1741030
Seismic Services Market Opportunity, Growth Drivers, Industry Trend Analysis, and Forecast 2025 - 2034
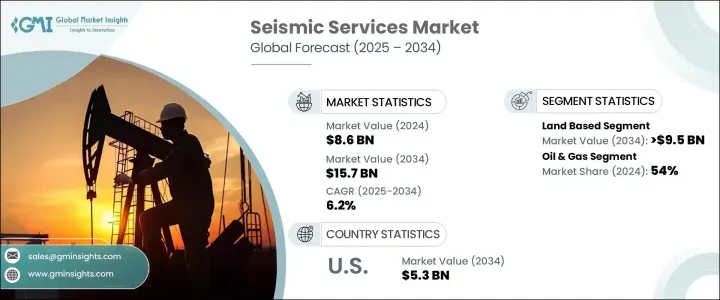
The Global Seismic Services Market was valued at USD 8.6 billion in 2024 and is estimated to grow at a CAGR of 6.2% to reach USD 15.7 billion by 2034, driven by major shifts in global energy exploration techniques, growing reliance on high-resolution subsurface imaging, and the rapid adoption of next-gen geophysical technologies. As the world moves toward more data-driven exploration, seismic services are evolving into a critical pillar of energy development strategies. Operators today demand faster, more accurate insights into subsurface structures, pushing seismic providers to deliver integrated, digital-first solutions. With the energy sector undergoing a major transition-balancing fossil fuels with renewables-the role of seismic technologies is expanding beyond oil and gas, penetrating sectors like offshore wind, geothermal, and mining. A rising emphasis on sustainable exploration, fueled by regulatory mandates and environmental assessments, is reshaping investment flows into seismic innovation. Companies are not only adopting advanced imaging techniques like 3D and 4D seismic but also infusing machine learning and AI into data processing to streamline operations, cut costs, and improve decision-making speed. As global energy demands grow more complex, the seismic services market is positioned as a crucial enabler of smarter, cleaner, and more efficient resource exploration.
Uncertainty in oil prices and shifting geopolitical scenarios continue to impact exploration budgets and seismic service volumes. Collaboration between service firms and energy producers remains vital to drive innovation and expand capabilities. Tariffs on critical seismic equipment and materials are increasing operational costs and could slow global cooperation, restricting access to cutting-edge technologies. Nevertheless, companies are finding ways to adapt through local sourcing strategies and digital innovation.
| Market Scope | |
|---|---|
| Start Year | 2024 |
| Forecast Year | 2025-2034 |
| Start Value | $8.6 Billion |
| Forecast Value | $15.7 Billion |
| CAGR | 6.2% |
Land-based seismic services are expected to dominate the industry, with projected revenues reaching USD 9.5 billion by 2034. These surveys remain essential in upstream exploration due to their cost-effectiveness and improved accuracy through advanced 3D and 4D imaging. Ongoing innovation in land acquisition technologies is making it easier to conduct detailed subsurface assessments across diverse terrains, significantly enhancing exploration outcomes.
In 2024, the oil and gas sector held a commanding 54% share, driven by rising workflow on AI-driven seismic analysis aimed at reducing exploration risks and improving resource targeting. The need for strategic minerals has fueled the adoption of seismic services in mining, while offshore wind and geothermal projects are increasingly relying on seismic imaging for environmental impact assessments and site viability studies, highlighting the broadening relevance of seismic tools across industries.
The U.S. Seismic Services Market generated USD 2.9 billion in 2024 and is projected to reach USD 5.3 billion by 2034. Exploration and production in shale basins and offshore areas such as the Gulf of Mexico continue to fuel demand. Providers are integrating machine learning, real-time imaging, and advanced data processing technologies to boost productivity and meet tightening regulatory standards, especially for renewable projects.
Leading players such as Halliburton, Paradigm Group B.V., CGG, TGS, Gardline Limited, SLB, Fugro, Getech Group plc, PGS, Spectrum Geophysics, SAExploration, Ramboll Group A/S, NUVIA Dynamics Inc., Weatherford, China Oilfield Services Limited, EGS (International) Ltd, Dawson Geophysical Company, and Abitibi Geophysics are actively consolidating their market presence. Their strategies include investing in real-time seismic data analytics, expanding offshore capabilities, forming joint ventures with energy providers, leveraging AI to streamline data workflows, and targeting the renewable sector through sustainable, low-impact seismic exploration techniques.
Table of Contents
Chapter 1 Methodology & Scope
- 1.1 Market definitions
- 1.2 Base estimates & calculations
- 1.3 Forecast calculation
- 1.4 Data sources
- 1.4.1 Primary
- 1.4.2 Secondary
- 1.4.2.1 Paid
- 1.4.2.2 Public
Chapter 2 Executive Summary
- 2.1 Industry synopsis, 2021 - 2034
Chapter 3 Industry Insights
- 3.1 Industry ecosystem analysis
- 3.2 Trump administration tariff analysis
- 3.2.1 Impact on trade
- 3.2.1.1 Trade volume disruptions
- 3.2.1.2 Retaliatory measures
- 3.2.2 Impact on the industry
- 3.2.2.1 Supply-side impact (raw materials)
- 3.2.2.1.1 Price volatility in key materials
- 3.2.2.1.2 Supply chain restructuring
- 3.2.2.1.3 Production cost implications
- 3.2.2.2 Demand-side impact (selling price)
- 3.2.2.2.1 Price transmission to end markets
- 3.2.2.2.2 Market share dynamics
- 3.2.2.2.3 Consumer response patterns
- 3.2.2.1 Supply-side impact (raw materials)
- 3.2.3 Key companies impacted
- 3.2.4 Strategic industry responses
- 3.2.4.1 Supply chain reconfiguration
- 3.2.4.2 Pricing and product strategies
- 3.2.4.3 Policy engagement
- 3.2.5 Outlook and future considerations
- 3.2.1 Impact on trade
- 3.3 Regulatory landscape
- 3.4 Industry impact forces
- 3.4.1 Growth drivers
- 3.4.2 Industry pitfalls & challenges
- 3.5 Growth potential analysis
- 3.6 Porter's analysis
- 3.6.1 Bargaining power of suppliers
- 3.6.2 Bargaining power of buyers
- 3.6.3 Threat of new entrants
- 3.6.4 Threat of substitutes
- 3.7 PESTEL analysis
Chapter 4 Competitive landscape, 2024
- 4.1 Strategic dashboard
- 4.2 Innovation & sustainability landscape
Chapter 5 Market Size and Forecast, By Survey Type, 2021 - 2034 (USD Million)
- 5.1 Key trends
- 5.2 Land based
- 5.3 Marine based
Chapter 6 Market Size and Forecast, By End Use, 2021 - 2034 (USD Million)
- 6.1 Key trends
- 6.2 Oil & gas
- 6.3 Mining
- 6.4 Others
Chapter 7 Market Size and Forecast, By Region, 2021 - 2034 (USD Million)
- 7.1 Key trends
- 7.2 North America
- 7.2.1 U.S.
- 7.2.2 Canada
- 7.3 Europe
- 7.3.1 UK
- 7.3.2 Germany
- 7.3.3 France
- 7.3.4 Norway
- 7.3.5 Russia
- 7.4 Asia Pacific
- 7.4.1 China
- 7.4.2 Japan
- 7.4.3 India
- 7.4.4 Australia
- 7.5 Middle East & Africa
- 7.5.1 UAE
- 7.5.2 Saudi Arabia
- 7.5.3 Iraq
- 7.5.4 Iran
- 7.5.5 South Africa
- 7.6 Latin America
- 7.6.1 Brazil
- 7.6.2 Argentina
Chapter 8 Company Profiles
- 8.1 Abitibi Geophysics
- 8.2 China Oilfield Services Limited
- 8.3 CGG
- 8.4 Dawson Geophysical Company
- 8.5 EGS (International) Ltd
- 8.6 Fugro
- 8.7 Getech Group plc
- 8.8 Gardline Limited
- 8.9 Halliburton
- 8.10 NUVIA Dynamics Inc.
- 8.11 PGS
- 8.12 Paradigm Group B.V.
- 8.13 Ramboll Group A/S
- 8.14 SLB
- 8.15 SAExploration
- 8.16 Spectrum Geophysics
- 8.17 TGS
- 8.18 Weatherford

