
PUBLISHER: Global Market Insights Inc. | PRODUCT CODE: 1716670

PUBLISHER: Global Market Insights Inc. | PRODUCT CODE: 1716670
Renewable Based Shunt Reactor Market Opportunity, Growth Drivers, Industry Trend Analysis, and Forecast 2025 - 2034
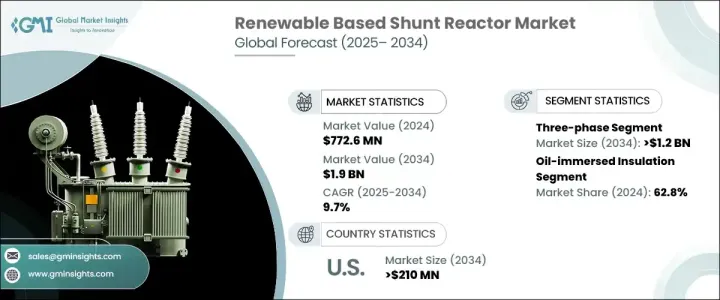
The Global Renewable Based Shunt Reactor Market was valued at USD 772.6 million in 2024 and is projected to grow at a CAGR of 9.7% between 2025 and 2034. The rapid expansion of renewable energy projects worldwide is a key factor fueling this growth. As the global transition to cleaner energy sources accelerates, the demand for efficient voltage control solutions is rising. Shunt reactors play a critical role in stabilizing electrical grids by managing reactive power, which enhances energy transmission efficiency and reliability.
With governments and private enterprises ramping up investments in renewable energy, the demand for grid-stabilizing solutions continues to surge. The integration of wind and solar power introduces fluctuations in electricity generation, increasing the necessity for advanced power management solutions. Additionally, regulatory policies promoting renewable energy adoption, coupled with funding for grid modernization, are driving further advancements in the market. The ongoing development of high-voltage transmission networks, particularly in emerging economies, is also contributing to market expansion. As more nations work toward achieving energy independence and reducing carbon emissions, the importance of grid stability solutions like renewable-based shunt reactors is becoming even more pronounced.
| Market Scope | |
|---|---|
| Start Year | 2024 |
| Forecast Year | 2025-2034 |
| Start Value | $772.6 Million |
| Forecast Value | $1.9 Billion |
| CAGR | 9.7% |
The shift toward decentralized energy sources is another major driver of market growth. With renewable energy facilities becoming more geographically widespread, efficient long-distance energy transmission is crucial. Shunt reactors help mitigate transmission losses, ensuring a stable and balanced power supply. Their ability to enhance grid integration, especially with the unpredictable nature of renewable energy sources, is positioning them as indispensable components in modern energy infrastructure.
The renewable-based shunt reactor market is segmented by phase type into single-phase and three-phase reactors. The three-phase segment is expected to generate USD 1.2 billion by 2034. These reactors are particularly effective for high-capacity grids, offering enhanced reactive power regulation and reducing transmission losses. As renewable energy projects continue to scale up, the demand for three-phase reactors is expected to rise significantly.
In terms of insulation type, oil-immersed shunt reactors accounted for 62.8% of the market share in 2024 and are projected to grow at a CAGR of 9% through 2034. These reactors are preferred for their superior insulation and cooling efficiency, making them ideal for high-voltage applications. Ongoing advancements in transformer oil technology are improving insulation properties, further driving market demand.
U.S. Renewable Based Shunt Reactor Market generated USD 97.5 million in 2024, driven by expanding renewable energy capacity and grid modernization efforts. The growing integration of wind and solar energy has introduced greater variability in power generation, making voltage control and grid stability more critical than ever. Shunt reactors are playing a pivotal role in addressing these challenges. Government incentives and increased investments in high-voltage transmission infrastructure continue to support market expansion in the U.S., making it a key player in the global renewable-based shunt reactor landscape.
Table of Contents
Chapter 1 Methodology & Scope
- 1.1 Market definitions
- 1.2 Base estimates & calculations
- 1.3 Forecast calculation
- 1.4 Data sources
- 1.4.1 Primary
- 1.4.2 Secondary
- 1.4.2.1 Paid
- 1.4.2.2 Public
Chapter 2 Executive Summary
- 2.1 Industry synopsis, 2021 - 2034
Chapter 3 Industry Insights
- 3.1 Industry ecosystem analysis
- 3.2 Regulatory landscape
- 3.3 Industry impact forces
- 3.3.1 Growth drivers
- 3.3.2 Industry pitfalls & challenges
- 3.4 Growth potential analysis
- 3.5 Porter's analysis
- 3.5.1 Bargaining power of suppliers
- 3.5.2 Bargaining power of buyers
- 3.5.3 Threat of new entrants
- 3.5.4 Threat of substitutes
- 3.6 PESTEL analysis
Chapter 4 Competitive Landscape, 2024
- 4.1 Strategic dashboard
- 4.2 Innovation & sustainability landscape
Chapter 5 Market Size and Forecast, By Phase, 2021 – 2034 (USD Million)
- 5.1 Key trends
- 5.2 Single phase
- 5.3 Three phase
Chapter 6 Market Size and Forecast, By Insulation, 2021 – 2034 (USD Million)
- 6.1 Key trends
- 6.2 Oil immersed
- 6.3 Air core
Chapter 7 Market Size and Forecast, By Product, 2021 – 2034 (USD Million)
- 7.1 Key trends
- 7.2 Fixed shunt reactors
- 7.3 Variable shunt reactors
Chapter 8 Market Size and Forecast, By Region, 2021 – 2034 (USD Million)
- 8.1 Key trends
- 8.2 North America
- 8.2.1 U.S.
- 8.2.2 Canada
- 8.3 Europe
- 8.3.1 UK
- 8.3.2 Germany
- 8.3.3 France
- 8.3.4 Italy
- 8.3.5 Russia
- 8.4 Asia Pacific
- 8.4.1 China
- 8.4.2 India
- 8.4.3 Japan
- 8.4.4 Australia
- 8.5 Middle East & Africa
- 8.5.1 Saudi Arabia
- 8.5.2 UAE
- 8.5.3 Qatar
- 8.5.4 South Africa
- 8.6 Latin America
- 8.6.1 Brazil
- 8.6.2 Argentina
Chapter 9 Company Profiles
- 9.1 CG Power & Industrial Solutions
- 9.2 Fuji Electric
- 9.3 GBE
- 9.4 GE
- 9.5 GETRA
- 9.6 Hitachi Energy
- 9.7 Hyosung Heavy Industries
- 9.8 NISSIN Electric
- 9.9 SGB SMIT
- 9.10 Shrihans Electricals
- 9.11 Siemens Energy
- 9.12 TMC Transformers Manufacturing Company
- 9.13 Toshiba Energy Systems & Solutions
- 9.14 WEG

