
PUBLISHER: Global Market Insights Inc. | PRODUCT CODE: 1741041

PUBLISHER: Global Market Insights Inc. | PRODUCT CODE: 1741041
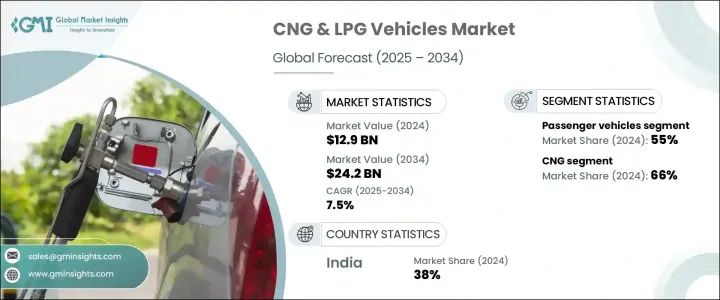
CNG and LPG Vehicles Market Opportunity, Growth Drivers, Industry Trend Analysis, and Forecast 2025 - 2034
The Global CNG and LPG Vehicles Market was valued at USD 12.9 billion in 2024 and is estimated to grow at a CAGR of 7.5% to reach USD 24.2 billion by 2034, driven by the surging demand for environmentally friendly and fuel-efficient vehicles. Growing public awareness about climate change and deteriorating air quality has pushed both governments and consumers toward greener mobility solutions. As energy security gains prominence worldwide, CNG and LPG vehicles are emerging as practical alternatives to traditional gasoline and diesel vehicles, offering substantial cost savings and lower carbon emissions. Countries around the world are rolling out aggressive emission norms, tightening fuel economy standards, and incentivizing alternative fuel adoption, making CNG and LPG vehicles an increasingly attractive choice. Technological advancements in CNG engines are further elevating vehicle performance while significantly cutting down harmful pollutants, positioning the market for strong future growth. Investment in clean energy infrastructure, retrofitting solutions, and the expansion of refueling networks is creating an ecosystem that supports long-term adoption. Moreover, rising fuel price volatility is pushing fleet operators and individual consumers to explore more economical and sustainable options, putting CNG and LPG vehicles at the forefront of future mobility trends.
CNG and LPG vehicles are becoming vital players in global sustainability initiatives as nations push for transportation alternatives that balance environmental responsibility with economic feasibility. Governments are taking bold steps by implementing stricter emission norms and offering attractive incentives, including tax rebates and grants, to drive the adoption of cleaner fuels. In several key markets, fleet operators are increasingly transitioning from diesel to CNG to realize long-term operational cost benefits. The availability of affordable retrofitting kits, combined with the growing presence of public transportation systems that favor cost-effective solutions, is reinforcing the trend toward CNG and LPG vehicle adoption among cost-sensitive consumers.
| Market Scope | |
|---|---|
| Start Year | 2024 |
| Forecast Year | 2025-2034 |
| Start Value | $12.9 Billion |
| Forecast Value | $24.2 Billion |
| CAGR | 7.5% |
The passenger vehicles segment dominated the market with a 55% share in 2024 and is projected to grow at a CAGR of 7% through 2034, as buyers prioritize affordability and environmental performance. On the commercial side, the rise of CNG-powered trucks and delivery vans is reshaping urban logistics by offering clean, fuel-efficient alternatives to traditional fleets. Commercial vehicles, particularly in urban environments, are benefiting from operational efficiencies and supportive policy frameworks. In dense metropolitan areas, three-wheelers running on CNG and LPG are gaining rapid traction, offering a practical and affordable solution for short-distance transportation.
The compressed natural gas (CNG) segment held a commanding 66% share of the global CNG and LPG vehicles market in 2024. Its leadership stems from the clear benefits it offers in terms of affordability, reduced emissions, and compliance with increasingly stringent environmental regulations. CNG continues to emerge as a preferred choice for both commercial fleets and individual consumers, thanks to its reduced carbon footprint and cost savings.
India's CNG and LPG Vehicles Market generated USD 2.4 billion in 2024, capturing a 38% share of the global market. Rapid urbanization, inflationary pressures on conventional fuel prices, and robust public policies favoring alternative fuels are driving this growth. Major cities are witnessing a steady shift toward cleaner public transportation options, with CNG buses and taxis leading the way. Retrofitting of internal combustion engine vehicles with CNG kits is further accelerating this transition across urban landscapes.
Leading automakers like Toyota, Hyundai Motor Company, Mahindra and Mahindra, Tata Motors, Ford Motor Company, General Motors, Volkswagen Group, IVECO, MAN SE, and Honda are heavily investing in product innovations, expanding their CNG and LPG vehicle portfolios, and strengthening their distribution networks. Many are collaborating with fuel providers to improve refueling infrastructure, especially in emerging markets. Strategies such as hybridized CNG technologies, smart vehicle integrations, and fleet partnership models are helping companies solidify their foothold in the evolving CNG and LPG vehicles market.
Table of Contents
Chapter 1 Methodology & Scope
- 1.1 Research design
- 1.1.1 Research approach
- 1.1.2 Data collection methods
- 1.2 Base estimates and calculations
- 1.2.1 Base year calculation
- 1.2.2 Key trends for market estimates
- 1.3 Forecast model
- 1.4 Primary research & validation
- 1.4.1 Primary sources
- 1.4.2 Data mining sources
- 1.5 Market definitions
Chapter 2 Executive Summary
- 2.1 Industry 3600 synopsis, 2021 - 2034
Chapter 3 Industry Insights
- 3.1 Industry ecosystem analysis
- 3.2 Supplier landscape
- 3.2.1 Fuel providers
- 3.2.2 Component manufacturers
- 3.2.3 Vehicle manufacturers (OEMs)
- 3.2.4 Retrofitters and aftermarket suppliers
- 3.2.5 Distribution and retail infrastructure
- 3.3 Profit margin analysis
- 3.4 Trump administration tariffs
- 3.4.1 Impact on the industry
- 3.4.1.1 Supply-side impact (raw materials)
- 3.4.1.1.1 Price volatility in key materials
- 3.4.1.1.2 Supply chain restructuring
- 3.4.1.1.3 Production cost implications
- 3.4.1.2 Demand-side impact (selling price)
- 3.4.1.2.1 Price transmission to end markets
- 3.4.1.2.2 Market share dynamics
- 3.4.1.1 Supply-side impact (raw materials)
- 3.4.2 Key companies impacted
- 3.4.1 Impact on the industry
- 3.5 Technology & innovation landscape
- 3.6 Patent analysis
- 3.7 Key news & initiatives
- 3.8 Regulatory landscape
- 3.9 Impact forces
- 3.9.1 Growth drivers
- 3.9.1.1 Rapid advancements in CNG technology
- 3.9.1.2 Increasing emphasis on sustainable mobility
- 3.9.1.3 Rising need for cost-effective transportation
- 3.9.1.4 Lower maintenance cost than petrol-powered vehicles
- 3.9.2 Industry pitfalls & challenges
- 3.9.2.1 Higher upfront costs
- 3.9.2.2 Reduced performance compared to petrol-powered vehicles
- 3.9.1 Growth drivers
- 3.10 Growth potential analysis
- 3.11 Porter's analysis
- 3.12 PESTEL analysis
Chapter 4 Competitive Landscape, 2024
- 4.1 Introduction
- 4.2 Company market share analysis
- 4.3 Competitive positioning matrix
- 4.4 Strategic outlook matrix
Chapter 5 Market Estimates & Forecast, By Vehicle, 2021 - 2034 ($Bn, Units)
- 5.1 Key trends
- 5.2 Passenger vehicles
- 5.2.1 Hatchback
- 5.2.2 Sedan
- 5.2.3 SUV
5.3 Three-wheelers
- 5.4 Commercial vehicles
- 5.4.1 Light Commercial Vehicles (LCV)
- 5.4.2 Medium Commercial Vehicles (MCV)
- 5.4.3 Heavy Commercial Vehicles (HCV)
Chapter 6 Market Estimates & Forecast, By Fuel, 2021 - 2034 ($Bn, Units)
- 6.1 Key trends
- 6.2 LPG
- 6.3 CNG
Chapter 7 Market Estimates & Forecast, By Engine System, 2021 - 2034 ($Bn, Units)
- 7.1 Key trends
- 7.2 Dedicated system
- 7.3 Bi-fuel
- 7.4 Dual fuel
Chapter 8 Market Estimates & Forecast, By Fitting, 2021 - 2034 ($Bn, Units)
- 8.1 Key trends
- 8.2 OEM
- 8.3 Aftermarket
Chapter 9 Market Estimates & Forecast, By Region, 2021 - 2034 ($Bn, Units)
- 9.1 Key trends
- 9.2 North America
- 9.2.1 U.S.
- 9.2.2 Canada
- 9.3 Europe
- 9.3.1 UK
- 9.3.2 Germany
- 9.3.3 France
- 9.3.4 Italy
- 9.3.5 Spain
- 9.3.6 Russia
- 9.3.7 Nordics
- 9.4 Asia Pacific
- 9.4.1 China
- 9.4.2 India
- 9.4.3 Japan
- 9.4.4 South Korea
- 9.4.5 ANZ
- 9.4.6 Southeast Asia
- 9.5 Latin America
- 9.5.1 Brazil
- 9.5.2 Mexico
- 9.5.3 Argentina
- 9.6 MEA
- 9.6.1 UAE
- 9.6.2 Saudi Arabia
- 9.6.3 South Africa
Chapter 10 Company Profiles
- 10.1 Ashok Leyland
- 10.2 Bajaj Auto
- 10.3 Ford Motor Company
- 10.4 General Motors
- 10.5 Honda
- 10.6 Hyundai Motor Company
- 10.7 Isuzu Motors
- 10.8 IVECO
- 10.9 Kia Motors
- 10.10 Landi Renzo
- 10.11 Mahindra & Mahindra
- 10.12 MAN SE
- 10.13 Maruti Suzuki
- 10.14 Renault
- 10.15 SEAT
- 10.16 Skoda Auto
- 10.17 Tata Motors
- 10.18 Toyota
- 10.19 Volkswagen Group
- 10.20 Westport Fuel Systems

