
PUBLISHER: Global Market Insights Inc. | PRODUCT CODE: 1699303

PUBLISHER: Global Market Insights Inc. | PRODUCT CODE: 1699303
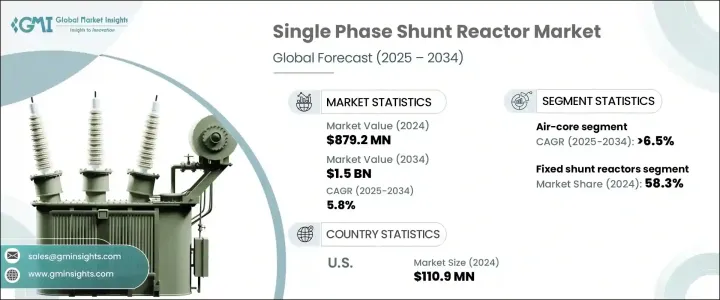
Single Phase Shunt Reactor Market Opportunity, Growth Drivers, Industry Trend Analysis, and Forecast 2025-2034
The Global Single-Phase Shunt Reactor Market reached USD 879.2 million in 2024 and is projected to expand at a CAGR of 5.8% from 2025 to 2034, driven by increasing investments in smart grids and digital substations. The rising demand for efficient energy transmission and enhanced grid stability is fueling the widespread adoption of these reactors across modern power networks. As utilities and grid operators focus on optimizing power quality, single-phase shunt reactors are playing a crucial role in voltage stabilization and reducing power losses.
A key factor driving market expansion is the increasing deployment of renewable energy sources, including wind and solar power, which require advanced grid management solutions to ensure seamless power integration. The growing push for electrification in the industrial and residential sectors is further amplifying the demand for reliable and efficient power transmission systems. Governments worldwide are strengthening their energy infrastructure to support sustainability goals, leading to greater investments in high-voltage transmission networks. With the power sector embracing automation and digitalization, the adoption of smart substations is accelerating, creating new opportunities for market players. Additionally, emerging technologies such as IoT-based monitoring systems and AI-driven grid analytics are enhancing operational efficiency, making single-phase shunt reactors more indispensable for modern energy networks.
| Market Scope | |
|---|---|
| Start Year | 2024 |
| Forecast Year | 2025-2034 |
| Start Value | $879.2 Million |
| Forecast Value | $1.5 Billion |
| CAGR | 5.8% |
The market continues to benefit from advancements in insulation technologies, with oil-immersed and air-core variants gaining significant traction. Oil-immersed shunt reactors are witnessing increasing demand due to their superior cooling capabilities and long operational life, making them a preferred choice for high-voltage applications. These reactors not only enhance grid stability but also improve the overall efficiency of power transmission, reinforcing their critical role in modern electricity infrastructure.
Segmented by product type, the market includes fixed and variable single-phase shunt reactors. In 2024, fixed shunt reactors accounted for 58.3% of the total market share and are expected to see continued growth due to their widespread application in transmission networks. However, utilities are increasingly turning toward variable single-phase shunt reactors, which offer greater flexibility to adjust to fluctuating grid conditions. These advanced solutions help optimize power usage, minimize transmission losses, and enhance overall grid adaptability. With growing concerns about voltage stability and efficient energy distribution, the adoption of variable reactors is set to rise significantly in the coming years.
The U.S. single-phase shunt reactor market reached USD 110.9 million in 2024 and continues to expand as federal initiatives focus on strengthening grid reliability. The nation's push toward smart grids and high-voltage transmission systems is fueling market growth, supported by large-scale investments in renewable energy integration. The broader North American market is benefiting from industrial expansion, infrastructure modernization, and increasing emphasis on energy efficiency. As utilities seek to enhance grid performance and ensure a stable power supply, the demand for advanced power management solutions remains robust, positioning single-phase shunt reactors as a key component in the region's evolving energy landscape.
Table of Contents
Chapter 1 Methodology & Scope
- 1.1 Market definitions
- 1.2 Base estimates & calculations
- 1.3 Forecast calculation
- 1.4 Data sources
- 1.4.1 Primary
- 1.4.2 Secondary
- 1.4.2.1 Paid
- 1.4.2.2 Public
Chapter 2 Executive Summary
- 2.1 Industry synopsis, 2021 - 2034
Chapter 3 Industry Insights
- 3.1 Industry ecosystem analysis
- 3.2 Regulatory landscape
- 3.3 Industry impact forces
- 3.3.1 Growth drivers
- 3.3.2 Industry pitfalls & challenges
- 3.4 Growth potential analysis
- 3.5 Porter's analysis
- 3.5.1 Bargaining power of suppliers
- 3.5.2 Bargaining power of buyers
- 3.5.3 Threat of new entrants
- 3.5.4 Threat of substitutes
- 3.6 PESTEL analysis
Chapter 4 Competitive Landscape, 2024
- 4.1 Strategic dashboard
- 4.2 Innovation & sustainability landscape
Chapter 5 Market Size and Forecast, By Insulation, 2021 – 2034 (USD Million)
- 5.1 Key trends
- 5.2 Oil immersed
- 5.3 Air core
Chapter 6 Market Size and Forecast, By Product, 2021 – 2034 (USD Million)
- 6.1 Key trends
- 6.2 Fixed shunt reactors
- 6.3 Variable shunt reactors
Chapter 7 Market Size and Forecast, By End Use, 2021 – 2034 (USD Million)
- 7.1 Key trends
- 7.2 Electric utility
- 7.3 Renewable energy
Chapter 8 Market Size and Forecast, By Region, 2021 – 2034 (USD Million)
- 8.1 Key trends
- 8.2 North America
- 8.2.1 U.S.
- 8.2.2 Canada
- 8.3 Europe
- 8.3.1 UK
- 8.3.2 Germany
- 8.3.3 France
- 8.3.4 Italy
- 8.3.5 Russia
- 8.4 Asia Pacific
- 8.4.1 China
- 8.4.2 India
- 8.4.3 Japan
- 8.4.4 Australia
- 8.5 Middle East & Africa
- 8.5.1 Saudi Arabia
- 8.5.2 UAE
- 8.5.3 Qatar
- 8.5.4 South Africa
- 8.6 Latin America
- 8.6.1 Brazil
- 8.6.2 Argentina
Chapter 9 Company Profiles
- 9.1 CG Power & Industrial Solutions
- 9.2 Fuji Electric
- 9.3 GE
- 9.4 GBE
- 9.5 GETRA
- 9.6 HICO America
- 9.7 Hitachi Energy
- 9.8 Hyosung Heavy Industries
- 9.9 Nissin Electric
- 9.10 SGB SMIT
- 9.11 Siemens Energy
- 9.12 Shrihans Electricals
- 9.13 Toshiba Energy Systems & Solutions
- 9.14 TMC Transformers Manufacturing Company
- 9.15 WEG

