
PUBLISHER: Global Market Insights Inc. | PRODUCT CODE: 1721510

PUBLISHER: Global Market Insights Inc. | PRODUCT CODE: 1721510
Activewear Market Opportunity, Growth Drivers, Industry Trend Analysis, and Forecast 2025 - 2034
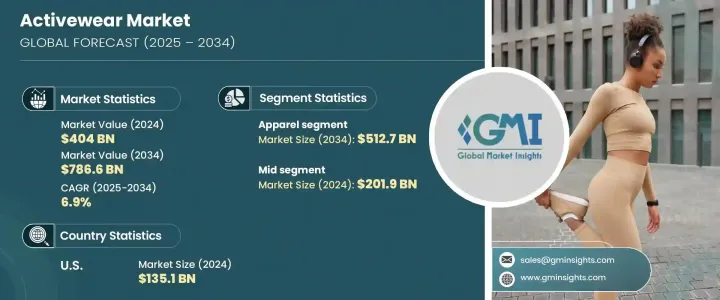
The Global Activewear Market was valued at USD 404 billion in 2024 and is estimated to grow at a CAGR of 6.9% to reach USD 786.6 billion by 2034. This upward trajectory reflects a major shift in consumer behavior, where health, wellness, and style converge to influence daily lifestyle choices. As fitness becomes a non-negotiable part of everyday life, activewear has evolved into much more than gym attire-it's now a symbol of commitment to well-being and personal expression. Consumers across all demographics are gravitating toward performance-based apparel that complements their fast-paced, hybrid lifestyles. The lines between athleticwear, loungewear, and casualwear continue to blur as consumers seek outfits that move with them from workout sessions to social gatherings and even office environments. Innovations in textile technologies, such as moisture-wicking fabrics, odor control, and enhanced breathability, are pushing functionality to new levels while maintaining a strong aesthetic appeal. With e-commerce and social media trends amplifying access and visibility, the market is witnessing an unprecedented rise in demand for versatile, stylish, and sustainable activewear.
Rising awareness around personal health and fitness remains a key growth driver, particularly among younger generations like Millennials and Gen Z. These age groups are embracing active lifestyles with greater enthusiasm than ever before, fueling the demand for functional and fashion-forward activewear. From gym workouts and yoga to hiking and outdoor recreational sports, consumers want clothing that performs just as well as it looks. Activewear is increasingly becoming a wardrobe essential, aligning with the broader lifestyle trend of wellness-centric living. Consumers across age groups and income levels now prioritize comfort, movement, and multipurpose use in their clothing choices, making performance apparel a go-to solution for everyday needs.
| Market Scope | |
|---|---|
| Start Year | 2024 |
| Forecast Year | 2025-2034 |
| Start Value | $404 Billion |
| Forecast Value | $786.6 Billion |
| CAGR | 6.9% |
In terms of product categories, apparel continues to lead the global activewear landscape, generating USD 262.5 billion in 2024 and projected to hit USD 512.7 billion by 2034. Its market dominance is driven by versatile products like leggings, tank tops, joggers, and sports bras that meet the needs of both casual wearers and fitness enthusiasts. As hybrid work patterns redefine dress codes, demand for high-quality, stylish, and durable apparel is accelerating. Shoppers are increasingly looking for pieces that offer both form and function-garments that transition seamlessly between workouts, errands, and informal professional settings.
On the pricing spectrum, the mid-tier segment accounted for 50% of the market share in 2024, generating USD 201.9 billion. This segment appeals to the largest share of consumers by offering quality, durability, and trend-right design at accessible price points. These products deliver performance without the luxury price tag, attracting loyal customers who value long-term utility and reputable branding.
The United States Activewear Market generated USD 135.1 billion in 2024 and is forecasted to grow at a CAGR of 6.8% through 2034. Growth in the US market is supported by high disposable income, a strong fitness culture, and increasing consumer preference for wellness-driven lifestyles. Americans continue to invest in activewear not just for workouts but for everyday comfort and functionality, pushing brands to offer premium designs with sustainability at the core.
Leading companies such as Gymshark, Lululemon Athletica Inc., NIKE, VF Corporation, Squat Wolf, New Balance, Adidas AG, Columbia Sportswear Company, Champion, Under Armour Inc., Fila Holdings Corporation, ASICS Corporation, ASOA PLC, Patagonia, PUMA SE, and Skechers are capitalizing on global expansion strategies and innovation. These brands are enhancing material science, scaling direct-to-consumer sales, and leveraging influencer collaborations to build stronger community connections. With a growing emphasis on eco-consciousness and tech-integrated designs, the competition in the activewear space continues to intensify.
Table of Contents
Chapter 1 Methodology & Scope
- 1.1 Market scope & definition
- 1.2 Base estimates & calculations
- 1.3 Forecast parameters
- 1.4 Data sources
- 1.4.1 Primary
- 1.4.2 Secondary
- 1.4.2.1 Paid sources
- 1.4.2.2 Public sources
Chapter 2 Executive Summary
- 2.1 Industry 3600 synopsis, 2021 - 2034
Chapter 3 Industry Insights
- 3.1 Industry ecosystem analysis
- 3.1.1 Factor affecting the value chain
- 3.1.2 Profit margin analysis
- 3.1.3 Disruptions
- 3.1.4 Future outlook
- 3.1.5 Manufacturers
- 3.1.6 Distributors
- 3.2 Key news & initiatives
- 3.3 Regulatory landscape
- 3.4 Impact forces
- 3.4.1 Growth drivers
- 3.4.1.1 Rising health consciousness and active lifestyles
- 3.4.1.2 Integration of fashion and functionality
- 3.4.1.3 Technological advancements in fabric and design
- 3.4.2 Industry pitfalls & challenges
- 3.4.2.1 Intense market competition and brand saturation
- 3.4.2.2 Supply chain challenges and environmental concerns
- 3.4.1 Growth drivers
- 3.5 Growth potential analysis
- 3.6 Porter’s analysis
- 3.7 PESTEL analysis
Chapter 4 Competitive Landscape, 2024
- 4.1 Introduction
- 4.2 Company market share analysis
- 4.3 Competitive positioning matrix
- 4.4 Strategic outlook matrix
Chapter 5 Market Estimates & Forecast, By Product Type, 2021 - 2034 (USD Billion) (Million Units)
- 5.1 Key Trends
- 5.2 Apparel
- 5.2.1 Top
- 5.2.1.1 T-Shirts
- 5.2.1.2 Tank tops
- 5.2.1.3 Sports bras
- 5.2.1.4 Jackets
- 5.2.1.5 Sweatshirts
- 5.2.1.6 Others (track suits, swimmer suits)
- 5.2.2 Bottom
- 5.2.2.1 Leggings
- 5.2.2.2 Shorts
- 5.2.2.3 Sweatpants
- 5.2.2.4 Track pants
- 5.2.2.5 Others (yoga pants, skirts)
- 5.2.1 Top
- 5.3 Footwear
- 5.4 Accessories
- 5.4.1 Headwear
- 5.4.2 Gloves
- 5.4.3 Others (wrist bands, waist band)
Chapter 6 Market Estimates & Forecast, By Usage, 2021 - 2034 (USD Billion) (Million Units)
- 6.1 Key trends
- 6.2 Running
- 6.3 Outdoor sports
- 6.4 Yoga & pilates
- 6.5 Gym & fitness training
- 6.6 Recreational activities
- 6.7 Others
Chapter 7 Market Estimates & Forecast, By Consumer Group, 2021 - 2034 (USD Billion) (Million Units)
- 7.1 Key trends
- 7.2 Male
- 7.3 Female
- 7.4 Kids
Chapter 8 Market Estimates & Forecast, By Price, 2021 - 2034, (USD Billion) (Million Units)
- 8.1 Key trends
- 8.2 Low
- 8.3 Medium
- 8.4 High
Chapter 9 Market Estimates & Forecast, By Distribution Channel, 2021 - 2034, (USD Billion) (Million Units)
- 9.1 Key trends
- 9.2 Online
- 9.2.1 E-commerce websites
- 9.2.2 Company websites
- 9.3 Offline
- 9.3.1 Specialty stores
- 9.3.2 Mega retails stores
- 9.3.3 Others (individual stores, departmental stores)
Chapter 10 Market Estimates & Forecast, By Region, 2021 - 2034, (USD Billion) (Million Units)
- 10.1 Key trends
- 10.2 North America
- 10.2.1 U.S.
- 10.2.2 Canada
- 10.3 Europe
- 10.3.1 Germany
- 10.3.2 U.K.
- 10.3.3 France
- 10.3.4 Italy
- 10.3.5 Spain
- 10.3.6 Russia
- 10.4 Asia Pacific
- 10.4.1 China
- 10.4.2 India
- 10.4.3 Japan
- 10.4.4 South Korea
- 10.4.5 Australia
- 10.5 Latin America
- 10.5.1 Brazil
- 10.5.2 Mexico
- 10.5.3 Argentina
- 10.6 MEA
- 10.6.1 UAE
- 10.6.2 Saudi Arabia
- 10.6.3 South Africa
Chapter 11 Company Profiles (Business Overview, Financial Data, Product Landscape, Strategic Outlook, SWOT Analysis)
- 11.1 Adidas AG
- 11.2 ASICS Corporation
- 11.3 ASOA PLC
- 11.4 Champion
- 11.5 Columbia Sportswear Company
- 11.6 Fila Holdings Corporation
- 11.7 Gymshark
- 11.8 Lululemon Athletica Inc.
- 11.9 New Balance
- 11.10 NIKE
- 11.11 Patagonia
- 11.12 PUMA SE
- 11.13 Skechers
- 11.14 Squat Wolf
- 11.15 Under Armour Inc.
- 11.16 VF Corporation

