PUBLISHER: Global Market Insights Inc. | PRODUCT CODE: 1716681

PUBLISHER: Global Market Insights Inc. | PRODUCT CODE: 1716681
Electrostatic Precipitator Market Opportunity, Growth Drivers, Industry Trend Analysis, and Forecast 2025 - 2034
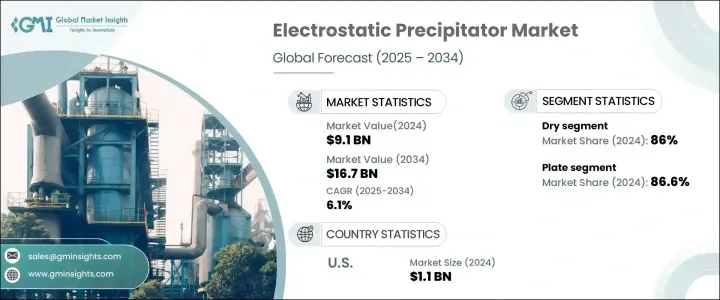
The Global Electrostatic Precipitator Market generated USD 9.1 billion in 2024 and is projected to grow at a CAGR of 6.1% between 2025 and 2034. This growth is primarily driven by the rapid industrialization of emerging economies, where industries such as steel manufacturing, chemical production, and coal-based power generation continue to expand. As these industries grow, the demand for efficient emissions control systems becomes increasingly critical. Governments worldwide are enforcing strict environmental regulations that require industries to implement advanced technologies to manage air pollution effectively. Electrostatic precipitators, known for their ability to efficiently remove particulate matter from industrial emissions, are gaining traction as industries strive to comply with these stringent standards. Additionally, growing awareness about environmental sustainability and the importance of reducing harmful emissions is pushing industries to invest in reliable air pollution control technologies.

The increasing focus on sustainable industrial practices, along with heightened public awareness of air quality concerns, is further amplifying the demand for electrostatic precipitators. Companies across various industries are recognizing the need to modernize their pollution control systems to meet evolving environmental standards and minimize their carbon footprint. Emerging economies, particularly in Asia-Pacific, are witnessing a surge in demand for electrostatic precipitators as industrial operations expand and governments enforce more rigorous air quality regulations. Moreover, advancements in ESP technology, including improvements in energy efficiency and particle removal capacity, are enhancing the appeal of these systems for industries aiming to balance operational efficiency with environmental compliance.
| Market Scope | |
|---|---|
| Start Year | 2024 |
| Forecast Year | 2025-2034 |
| Start Value | $9.1 Billion |
| Forecast Value | $16.7 Billion |
| CAGR | 6.1% |
The dry electrostatic precipitator segment accounted for 86% of the market share in 2024, reflecting its popularity in industries that require efficient removal of particulate matter from flue gases. These systems are particularly favored in sectors such as cement and steel production, where maintaining compliance with strict environmental regulations is essential. Dry electrostatic precipitators offer high efficiency in capturing fine particles while keeping operational costs low, making them a preferred choice for industries seeking reliable emissions control solutions.
By design, the market is divided into plate and tubular segments, with plate electrostatic precipitators capturing an 86.6% share in 2024. Plate ESPs are widely used in industrial applications due to their ability to capture both dry and wet particles with minimal energy consumption. Their low operating costs and high efficiency make them an ideal solution for industries that need dependable pollution control technologies.
The US electrostatic precipitator market generated USD 1.1 billion in 2024, driven by continued investments in pollution control technologies and the implementation of stricter air quality regulations. As public concern about air quality intensifies, the adoption of electrostatic precipitators is expected to increase further, contributing to sustained market growth in the coming years. The rising demand for cleaner air and the need for industries to meet environmental compliance standards are key factors supporting the expansion of the US electrostatic precipitator market.
Table of Contents
Chapter 1 Methodology & Scope
- 1.1 Research design
- 1.2 Base estimates & calculations
- 1.3 Forecast model
- 1.4 Primary research & validation
- 1.4.1 Primary sources
- 1.4.2 Data mining sources
- 1.5 Market definitions
Chapter 2 Executive Summary
- 2.1 Industry synopsis, 2021 – 2034
Chapter 3 Industry Insights
- 3.1 Industry ecosystem
- 3.2 Regulatory landscape
- 3.3 Industry impact forces
- 3.3.1 Growth drivers
- 3.3.2 Industry pitfalls & challenges
- 3.4 Growth potential analysis
- 3.5 Porter's analysis
- 3.5.1 Bargaining power of suppliers
- 3.5.2 Bargaining power of buyers
- 3.5.3 Threat of new entrants
- 3.5.4 Threat of substitutes
- 3.6 PESTEL analysis
Chapter 4 Competitive Landscape, 2024
- 4.1 Introduction
- 4.2 Strategic dashboard
- 4.3 Innovation & technology landscape
Chapter 5 Market Size and Forecast, By System, 2021 – 2034 (USD Billion)
- 5.1 Key trends
- 5.2 Dry
- 5.3 Wet
Chapter 6 Market Size and Forecast, By Design, 2021 – 2034 (USD Billion)
- 6.1 Key trends
- 6.2 Plate
- 6.3 Tubular
Chapter 7 Market Size and Forecast, By Emitting Industry, 2021 – 2034 (USD Billion)
- 7.1 Key trends
- 7.2 Power generation
- 7.3 Chemicals and petrochemicals
- 7.4 Cement
- 7.5 Metal processing & mining
- 7.6 Manufacturing
- 7.7 Marine
- 7.8 Others
Chapter 8 Market Size and Forecast, By Region, 2021 – 2034 (USD Billion)
- 8.1 Key trends
- 8.2 North America
- 8.2.1 U.S.
- 8.2.2 Canada
- 8.2.3 Mexico
- 8.3 Europe
- 8.3.1 Germany
- 8.3.2 UK
- 8.3.3 France
- 8.3.4 Spain
- 8.3.5 Italy
- 8.3.6 Netherlands
- 8.4 Asia Pacific
- 8.4.1 China
- 8.4.2 India
- 8.4.3 Japan
- 8.4.4 South Korea
- 8.4.5 Indonesia
- 8.4.6 Australia
- 8.5 Middle East & Africa
- 8.5.1 Saudi Arabia
- 8.5.2 UAE
- 8.5.3 South Africa
- 8.5.4 Nigeria
- 8.5.5 Angola
- 8.6 Latin America
- 8.6.1 Brazil
- 8.6.2 Argentina
- 8.6.3 Chile
- 8.6.4 Peru
Chapter 9 Company Profiles
- 9.1 Babcock and Wilcox Enterprises
- 9.2 DURR Group
- 9.3 DUCON
- 9.4 FLSmidth
- 9.5 Fuel Tech
- 9.6 GEA Group
- 9.7 GEECO Enercon
- 9.8 KC Cottrell India
- 9.9 Monroe Environmental
- 9.10 Mitsubishi Heavy Industries.
- 9.11 Sumitomo Heavy Industries
- 9.12 Trion
- 9.13 Valmet
- 9.14 Wood


