
PUBLISHER: Global Market Insights Inc. | PRODUCT CODE: 1740867

PUBLISHER: Global Market Insights Inc. | PRODUCT CODE: 1740867
Renewable Energy Certificate (REC) Market Opportunity, Growth Drivers, Industry Trend Analysis, and Forecast 2025 - 2034
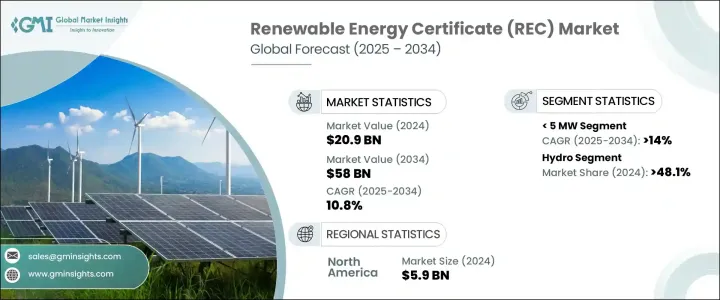
The Global Renewable Energy Certificate Market was valued at USD 20.9 billion in 2024 and is estimated to grow at a CAGR of 10.8% to reach USD 58 billion by 2034, driven by growing global demand for sustainable energy and increasing awareness of environmental responsibility among corporations and consumers. This significant growth trajectory is fueled by a combination of technological innovations, supportive policies, and a shift in global energy strategies toward cleaner sources.
The integration of advanced technologies has notably improved market operations, particularly in enhancing transparency and reducing the chances of fraudulent activities. Blockchain is playing a key role by enabling secure, traceable REC transactions, which is critical for maintaining the authenticity and trustworthiness of certificates. Additionally, standardized frameworks such as international certification protocols have helped streamline the issuance and trading of RECs across different geographic markets, making cross-border trade smoother and more efficient.
| Market Scope | |
|---|---|
| Start Year | 2024 |
| Forecast Year | 2025-2034 |
| Start Value | $20.9 Billion |
| Forecast Value | $58 Billion |
| CAGR | 10.8% |
RECs continue to gain traction in numerous countries, with a growing number of businesses and individuals embracing them as part of broader sustainability goals. These certificates serve as official proof of the generation of a specific amount of electricity from renewable sources such as wind, solar, hydro, or biomass. For companies aiming to meet carbon neutrality goals, RECs provide a practical and verifiable path to support renewable energy without the need to generate it directly.
In terms of capacity segmentation, the market is categorized into installations of 5 MW, greater than 5 MW up to 15 MW, over 15 MW up to 30 MW, and those exceeding 30 MW. Among these, the 5 MW segment is expected to witness the fastest growth, with a projected CAGR of more than 14% through 2034. This growth is largely attributed to the increasing deployment of small-scale solar farms, which are becoming more common as technological costs decline and installation efficiency improves globally.
From a source perspective, the market is classified into categories such as bioenergy, solar, wind, hydro, waste, and others. Hydropower led the market in 2024, accounting for over 48.1% of total REC transactions. Its leading position is driven by favorable governmental support, which encourages hydro adoption through incentives and policy frameworks. Hydro energy's high efficiency and reliability make it an appealing option for nations looking to expand renewable capacity without sacrificing consistency in energy supply.
North America continues to be a significant player in the global REC industry, with the market valued at USD 5 billion in 2022, USD 5.4 billion in 2023, and USD 5.9 billion in 2024. The region's focus on transitioning toward clean energy and meeting ambitious carbon reduction targets has made RECs an integral part of its sustainability infrastructure. Increasing demand for RECs in North America is being shaped by compliance mandates, voluntary corporate commitments, and progressive energy procurement practices.
RECs serve as a critical mechanism for businesses and utilities to align with environmental mandates and internal sustainability goals. By acquiring RECs, organizations demonstrate their support for renewable power generation and contribute to reducing greenhouse gas emissions without altering their physical energy consumption setup. This flexibility has made RECs particularly attractive to enterprises seeking to enhance their environmental, social, and governance (ESG) profiles.
Market leadership is concentrated among a handful of firms that collectively hold over 30% of the market share. These include major players who have made substantial investments in digital platforms, international partnerships, and integrated energy trading networks. Their dominance is reinforced by strategic relationships, long-term contracts, and ongoing technological advancements. Many of these companies have also introduced innovative tools and data platforms aimed at increasing market transparency and supporting REC portfolio management for their clients.
Table of Contents
Chapter 1 Methodology & Scope
- 1.1 Market scope & definitions
- 1.2 Market estimates & forecast parameters
- 1.3 Forecast calculation
- 1.4 Data sources
- 1.4.1 Primary
- 1.4.2 Secondary
- 1.4.2.1 Paid
- 1.4.2.2 Public
Chapter 2 Executive Summary
- 2.1 Industry synopsis, 2021 - 2034
Chapter 3 Industry Insights
- 3.1 Industry ecosystem analysis
- 3.2 Trump administration tariffs analysis
- 3.2.1 Impact on trade
- 3.2.1.1 Trade volume disruptions
- 3.2.1.2 Retaliatory measures
- 3.2.2 Impact on the industry
- 3.2.2.1 Supply-side impact (raw materials)
- 3.2.2.1.1 Price volatility in key materials
- 3.2.2.1.2 Supply chain restructuring
- 3.2.2.1.3 Production cost implications
- 3.2.2.2 Demand-side impact (selling price)
- 3.2.2.2.1 Price transmission to end markets
- 3.2.2.2.2 Market share dynamics
- 3.2.2.2.3 Consumer response patterns
- 3.2.2.1 Supply-side impact (raw materials)
- 3.2.3 Key companies impacted
- 3.2.4 Strategic industry responses
- 3.2.4.1.1 Supply chain reconfiguration
- 3.2.4.1.2 Pricing and product strategies
- 3.2.4.1.3 Policy engagement
- 3.2.5 Outlook and future considerations
- 3.2.1 Impact on trade
- 3.3 Regulatory landscape
- 3.4 Industry impact forces
- 3.4.1 Growth drivers
- 3.4.2 Industry pitfalls & challenges
- 3.5 Growth potential analysis
- 3.6 Porter's analysis
- 3.6.1 Bargaining power of suppliers
- 3.6.2 Bargaining power of buyers
- 3.6.3 Threat of new entrants
- 3.6.4 Threat of substitutes
- 3.7 PESTEL analysis
Chapter 4 Competitive Landscape, 2024
- 4.1 Introduction
- 4.2 Strategic dashboard
- 4.3 Strategic initiative
- 4.4 Company market share
- 4.5 Competitive benchmarking
- 4.6 Innovation & sustainability landscape
Chapter 5 Market Size and Forecast, By Capacity, 2021 - 2034 (USD Billion)
- 5.1 Key trends
- 5.2 < 5 MW
- 5.3 > 5 MW - 15 MW
- 5.4 > 15 MW - 30 MW
- 5.5 > 30 MW
Chapter 6 Market Size and Forecast, By Type, 2021 - 2034 (USD Billion)
- 6.1 Key trends
- 6.2 Voluntary
- 6.3 Compliance
Chapter 7 Market Size and Forecast, By Source, 2021 - 2034 (USD Billion)
- 7.1 Key trends
- 7.2 Bioenergy
- 7.3 Hydro
- 7.4 Solar
- 7.5 Wind
- 7.6 Waste
- 7.7 Others
Chapter 8 Market Size and Forecast, By Region, 2021 - 2034 (USD Billion)
- 8.1 Key trends
- 8.2 North America
- 8.3 Europe
- 8.4 Asia Pacific
- 8.5 Rest of world
Chapter 9 Company Profiles
- 9.1 3Degrees
- 9.2 Ecohz
- 9.3 Shell
- 9.4 Statkraft
- 9.5 Xpansiv
- 9.6 ENGIE
- 9.7 Enel Green Power
- 9.8 STX Group
- 9.9 TerraPass
- 9.10 BEF
- 9.11 Targray
- 9.12 Ameresco
- 9.13 Sterling Planet
- 9.14 Constellation

