
PUBLISHER: Global Market Insights Inc. | PRODUCT CODE: 1741046

PUBLISHER: Global Market Insights Inc. | PRODUCT CODE: 1741046
Chemical Liquid Hydrogen Market Opportunity, Growth Drivers, Industry Trend Analysis, and Forecast 2025 - 2034
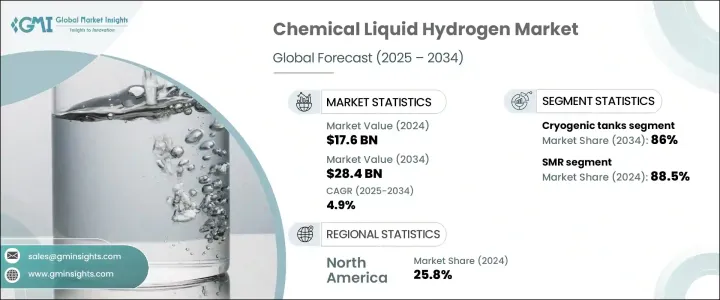
The Global Chemical Liquid Hydrogen Market was valued at USD 17.6 billion in 2024 and is estimated to grow at a CAGR of 4.9% to reach USD 28.4 billion by 2034 as chemical producers pursue low-emission feedstocks to align with global climate targets. Demand for chemical liquid hydrogen is accelerating as industries worldwide move aggressively toward decarbonization strategies. Governments and private players are investing heavily in hydrogen infrastructure, driven by the urgency to meet net-zero goals. The market is witnessing a shift toward green hydrogen production, fueled by lower renewable energy costs and technological breakthroughs. Policy support, growing investor confidence, and strategic public-private partnerships are creating a vibrant ecosystem for hydrogen development. Increasing funding in electrolyzer advancements, carbon capture technologies, and scalable liquefaction systems is making chemical liquid hydrogen more commercially feasible and environmentally sustainable. As industrial sectors such as chemicals, heavy industries, and transportation sectors ramp up their clean energy commitments, the need for accessible and flexible hydrogen solutions is becoming even more critical. This momentum is setting the stage for robust market growth through the next decade.
A growing shift toward green hydrogen is driving adoption across industrial applications. Cost reductions in renewable energy, particularly solar and wind, are making electrolytic hydrogen more commercially viable. Simultaneously, advancements in electrolyzer technology and carbon capture systems are improving the efficiency and sustainability of production processes. These innovations are allowing industries to decarbonize more rapidly and meet regulatory expectations.
| Market Scope | |
|---|---|
| Start Year | 2024 |
| Forecast Year | 2025-2034 |
| Start Value | $17.6 Billion |
| Forecast Value | $28.4 Billion |
| CAGR | 4.9% |
The increased deployment of flexible infrastructure and pricing models makes hydrogen more accessible to industrial users. Transparent spot pricing creates new opportunities for buyers who prefer on-demand supply without long-term commitments, encouraging broader participation across sectors. This progress boosts investor confidence, accelerating funding for clean hydrogen initiatives. Public-private partnerships continue to help in advancing infrastructure, particularly for liquid hydrogen storage and transportation.
Efforts to commercialize large-scale ammonia conversion and liquefaction systems for hydrogen distribution are gaining traction. These developments are improving the economic viability of long-distance transport, helping meet rising global demand. However, ongoing international trade policies that raise import tariffs on hydrogen-related equipment may inflate future production costs, creating friction in global supply chains. This may also restrict innovation and slow market expansion in several regions, particularly where clean energy infrastructure is still emerging.
The coal gasification segment generated USD 1.1 billion in 2024 and is poised to grow further by 2034. Its appeal lies in converting abundant coal reserves into hydrogen, supporting energy diversification strategies. As more emphasis is placed on energy security and reducing reliance on traditional fuel imports, interest in this method remains strong. Integrating carbon capture into coal-based hydrogen production makes the process cleaner, helping bridge the transition to fully renewable alternatives.
In terms of distribution, pipelines and cryogenic tanks remain the two primary methods for transporting chemical liquid hydrogen, each offering distinct advantages based on use cases and geographic needs. Cryogenic tanks held an 86% share in 2024, underscoring their critical role in enabling the storage and movement of large volumes of liquid hydrogen within chemical production environments. These tanks are engineered to withstand extreme cold temperatures, preserving hydrogen in its liquefied state and minimizing energy losses during storage and transport. Their dominance is further supported by innovations in vacuum insulation and multilayer composite materials, which significantly reduce boil-off rates and improve overall safety.
U.S. Chemical Liquid Hydrogen Market generated USD 4.1 billion in 2024, fueled by an aggressive national push toward clean energy, backed by significant public and private sector investments. Federal incentives, grants, and policy frameworks have enabled the rapid development of hydrogen production and storage facilities across key industrial regions. Increased interest from sectors such as chemicals, heavy industry, and transportation is driving the need for robust hydrogen supply chains.
Companies like Ballard Power Systems, TotalEnergies, Chart Industries, Messer Group, Linde, Plug Power, ENGIE, Air Products and Chemicals, Iwatani Corporation, ENEOS Corporation, Taiyo Nippon Sanso Corporation, Air Liquide, and Nel ASA are focusing on multiple strategies to secure market share. Key initiatives include investing in high-efficiency production technologies, forming strategic alliances with energy and chemical firms, and building modular, scalable hydrogen plants. These players prioritize digital integration for supply monitoring and investing in infrastructure to ensure reliable distribution while aligning with regional clean energy policies.
Table of Contents
Chapter 1 Methodology & Scope
- 1.1 Research design
- 1.2 Base estimates & calculations
- 1.3 Forecast calculation
- 1.4 Primary research & validation
- 1.4.1 Primary sources
- 1.4.2 Data mining sources
- 1.5 Market definitions
Chapter 2 Executive Summary
- 2.1 Industry synopsis, 2021 – 2034
Chapter 3 Industry Insights
- 3.1 Industry ecosystem
- 3.2 Trump administration tariff analysis
- 3.2.1 Impact on trade
- 3.2.1.1 Trade volume disruptions
- 3.2.1.2 Retaliatory measures
- 3.2.2 Impact on the industry
- 3.2.2.1 Supply-side impact (raw materials)
- 3.2.2.1.1 Price volatility in key materials
- 3.2.2.1.2 Supply chain restructuring
- 3.2.2.1.3 Production cost implications
- 3.2.2.2 Demand-side impact (selling price)
- 3.2.2.2.1 Price transmission to end markets
- 3.2.2.2.2 Market share dynamics
- 3.2.2.2.3 Consumer response patterns
- 3.2.2.1 Supply-side impact (raw materials)
- 3.2.3 Key companies impacted
- 3.2.4 Strategic industry responses
- 3.2.4.1 Supply chain reconfiguration
- 3.2.4.2 Pricing and product strategies
- 3.2.4.3 Policy engagement
- 3.2.5 Outlook and future considerations
- 3.2.1 Impact on trade
- 3.3 Regulatory landscape
- 3.4 Industry impact forces
- 3.4.1 Growth drivers
- 3.4.2 Industry pitfalls & challenges
- 3.5 Growth potential analysis
- 3.6 Porter's analysis
- 3.6.1 Bargaining power of suppliers
- 3.6.2 Bargaining power of buyers
- 3.6.3 Threat of new entrants
- 3.6.4 Threat of substitutes
- 3.7 PESTEL analysis
Chapter 4 Competitive landscape, 2024
- 4.1 Introduction
- 4.2 Strategic dashboard
- 4.3 Innovation & sustainability landscape
Chapter 5 Market Size and Forecast, By Production, 2021 – 2034 (USD Billion & MT)
- 5.1 Key trends
- 5.2 Coal gasification
- 5.3 SMR
- 5.4 Electrolysis
Chapter 6 Market Size and Forecast, By Distribution, 2021 – 2034 (USD Billion & MT)
- 6.1 Key trends
- 6.2 Pipelines
- 6.3 Cryogenic tanks
Chapter 7 Market Size and Forecast, By Region, 2021 – 2034 (USD Billion & MT)
- 7.1 Key trends
- 7.2 North America
- 7.2.1 U.S.
- 7.2.2 Canada
- 7.3 Europe
- 7.3.1 Germany
- 7.3.2 UK
- 7.3.3 France
- 7.3.4 Italy
- 7.4 Asia Pacific
- 7.4.1 China
- 7.4.2 India
- 7.4.3 Japan
- 7.4.4 South Korea
- 7.4.5 Australia
- 7.5 Rest of World
Chapter 8 Company Profiles
- 8.1 Air Liquide
- 8.2 Air Products and Chemicals
- 8.3 Ballard Power Systems
- 8.4 Chart Industries
- 8.5 ENGIE
- 8.6 ENEOS Corporation
- 8.7 Hexagon Composites
- 8.8 Iwatani Corporation
- 8.9 Linde
- 8.10 Messer Group
- 8.11 Nel ASA
- 8.12 Plug Power
- 8.13 TotalEnergies
- 8.14 Taiyo Nippon Sanso Corporation

