
PUBLISHER: Global Market Insights Inc. | PRODUCT CODE: 1755201

PUBLISHER: Global Market Insights Inc. | PRODUCT CODE: 1755201
Asia-Pacific Mobility-as-a-Service Market Opportunity, Growth Drivers, Industry Trend Analysis, and Forecast 2025 - 2034
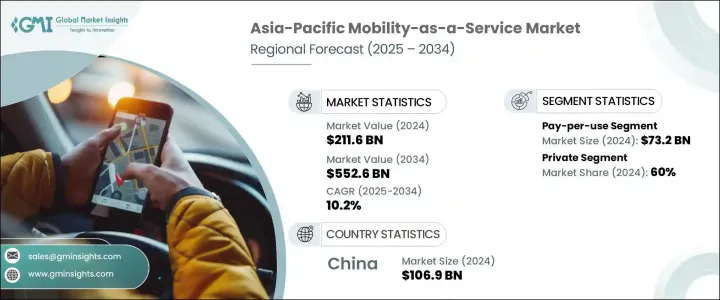
Asia-Pacific Mobility-as-a-Service Market was valued at USD 211.6 billion in 2024 and is estimated to grow at a CAGR of 10.2% to reach USD 552.6 billion by 2034. This growth is largely driven by fast-paced urbanization, increasing smartphone usage, and rising demand for efficient, sustainable urban mobility. As cities become more congested and environmental concerns intensify, governments and urban planners across the region are actively supporting MaaS initiatives to integrate diverse transportation options into unified digital platforms.
These platforms are designed to reduce emissions, ease traffic, and offer commuters a more seamless and connected travel experience. By merging various mobility services into a single, app-based interface, MaaS is reshaping how individuals plan, book, and pay for transportation. The evolution of MaaS is not only transforming transportation infrastructure but also changing commuter expectations by offering smarter, cleaner, and more convenient mobility solutions.
| Market Scope | |
|---|---|
| Start Year | 2024 |
| Forecast Year | 2025-2034 |
| Start Value | $211.6 Billion |
| Forecast Value | $552.6 Billion |
| CAGR | 10.2% |
Asia-Pacific Mobility-as-a-Service platforms are rapidly adopting sophisticated features such as AI-powered demand forecasting, dynamic routing, real-time journey updates, and centralized digital payment systems. These innovations enable end-to-end mobility across public and private modes with a single application. Companies are leveraging advanced technologies like 5G, cloud infrastructure, and IoT to enhance the personalization, speed, and efficiency of travel services. Strategic partnerships between private firms and public institutions are accelerating development, supported by government-backed sustainability initiatives. Digital mobility wallets, AI-based traffic modeling, and blockchain-integrated fare systems are reshaping operational standards while improving performance.
The pay-per-use segment was valued at USD 73.2 billion in 2024. Its appeal lies in its flexible and cost-effective nature, which caters to commuters seeking affordability and convenience without long-term commitments. This model allows users to pay only for individual rides or services, making it popular among both frequent and occasional riders. It also ensures accessibility across different income segments and geographic regions, particularly in Tier II and III cities where subscription plans may not be feasible. Integration with mobile wallets and digital payment apps enhances user convenience, allowing for fast, contactless transactions that encourage greater adoption across various user demographics.
In 2024, private transportation services captured a 60% share, underscoring their growing importance in the MaaS ecosystem. The surge in demand for ride-hailing, micro-mobility, and car-sharing options, particularly in dense urban zones, is driving this trend. Private providers offer enhanced user experiences with features like real-time tracking, on-demand access, and personalized routes. These services also allow for scalable pricing models and frequent updates that cater to tech-savvy users seeking convenience and immediacy. Moreover, the ongoing shift toward electric vehicles and environmentally conscious commuting among private MaaS providers supports the push for cleaner, more sustainable transportation alternatives throughout the region.
China Mobility-as-a-Service Market generated USD 106.9 billion in 2024 and is forecasted to grow at a CAGR of 10.2% through 2034. This leadership is underpinned by rising urban density, widespread mobile connectivity, and proactive government support for smart transport systems. The country's MaaS growth is further boosted by the implementation of advanced technologies, including AI, big data analytics, and 5G infrastructure. These tools empower MaaS providers to deliver integrated services that combine public and private transit options in one platform. Policies encouraging low-emission vehicles and shared transport models are also playing a key role in expanding access to sustainable mobility across both megacities and emerging urban areas.
Prominent companies driving the Asia-Pacific Mobility-as-a-Service Market include GoTo, BlueSG, SkedGo, Grab, Pony.ai, Meituan, Uber, Ola, Oyika, and DiDi Chuxing. To secure a stronger foothold in the Asia-Pacific mobility-as-a-service market, companies are implementing a range of innovative strategies. Leading players are heavily investing in AI, cloud computing, and 5G to offer real-time, integrated transport solutions. Expansion into underserved Tier II and III cities helps widen the customer base, while partnerships with governments ensure alignment with urban planning goals. Firms are enhancing user experience through mobile-first platforms that provide unified booking, payment, and route planning across different transport modes. Sustainability remains a core focus, with increased adoption of electric fleets and low-emission solutions.
Table of Contents
Chapter 1 Methodology & Scope
- 1.1 Market scope and definition
- 1.2 Research design
- 1.2.1 Research approach
- 1.2.2 Data collection methods
- 1.3 Data mining sources
- 1.3.1 Global
- 1.3.2 Regional/Country
- 1.4 Base estimates and calculations
- 1.4.1 Base year calculation
- 1.4.2 Key trends for market estimation
- 1.5 Primary research and validation
- 1.5.1 Primary sources
- 1.6 Forecast model
- 1.7 Research assumptions and limitations
Chapter 2 Executive Summary
- 2.1 Industry 3600 synopsis
- 2.2 Key market trends
- 2.2.1 Countries
- 2.2.2 Business model
- 2.2.3 Application
- 2.2.4 Transportation
- 2.2.5 Payment
- 2.2.6 Solution
- 2.2.7 Services
- 2.2.8 Requirement
- 2.3 TAM Analysis, 2025-2034
- 2.4 CXO perspectives: Strategic imperatives
- 2.4.1 Executive decision points
- 2.4.2 Critical success factors
- 2.5 Future outlook and strategic recommendations
Chapter 3 Industry Insights
- 3.1 Industry ecosystem analysis
- 3.1.1 Supplier landscape
- 3.1.2 Profit margin
- 3.1.3 Cost structure
- 3.1.4 Value addition at each stage
- 3.1.5 Factor affecting the value chain
- 3.1.6 Disruptions
- 3.2 Industry impact forces
- 3.2.1 Growth drivers
- 3.2.1.1 Rapid urbanization and rising population density
- 3.2.1.2 High smartphone & internet penetration
- 3.2.1.3 Strong government support and policy frameworks
- 3.2.1.4 Technological advancements in AI, IoT, cloud computing
- 3.2.2 Industry pitfalls and challenges
- 3.2.2.1 Inconsistent and underdeveloped public transport infrastructure
- 3.2.2.2 Fragmented regulatory landscape across countries
- 3.2.3 Market opportunities
- 3.2.3.1 Rising demand for multimodal transport integration
- 3.2.3.2 Private sector innovation & foreign investments
- 3.2.1 Growth drivers
- 3.3 Growth potential analysis
- 3.4 Regulatory landscape
- 3.4.1 China
- 3.4.2 Japan
- 3.4.3 India
- 3.4.4 South Korea
- 3.4.5 ANZ
- 3.4.6 Southeast Asia China
- 3.4.7 Japan
- 3.4.8 India
- 3.4.9 South Korea
- 3.4.10 Australia
- 3.4.11 New Zealand
- 3.4.12 Indonesia
- 3.4.13 Malaysia
- 3.4.14 Singapore
- 3.4.15 Thailand
- 3.4.16 Vietnam
- 3.4.17 Cambodia
- 3.5 Porter's analysis
- 3.6 PESTEL analysis
- 3.7 Technology and innovation landscape
- 3.7.1 Current technological trends
- 3.7.2 Emerging technologies
- 3.8 Cost breakdown analysis
- 3.9 Patent analysis
- 3.10 Sustainability and environmental aspects
- 3.10.1 Sustainable practices
- 3.10.2 Waste reduction strategies
- 3.10.3 Energy efficiency in production
- 3.10.4 Eco-friendly initiatives
- 3.10.5 Carbon footprint considerations
Chapter 4 Competitive Landscape, 2024
- 4.1 Introduction
- 4.2 Company market share analysis
- 4.2.1 China
- 4.2.2 Japan
- 4.2.3 India
- 4.2.4 South Korea
- 4.2.5 Australia
- 4.2.6 New Zealand
- 4.2.7 Indonesia
- 4.2.8 Malaysia
- 4.2.9 Singapore
- 4.2.10 Thailand
- 4.2.11 Vietnam
- 4.2.12 Cambodia
- 4.3 Competitive analysis of major market players
- 4.4 Competitive positioning matrix
- 4.5 Strategic outlook matrix
- 4.6 Key developments
- 4.6.1 Mergers & acquisitions
- 4.6.2 Partnerships & collaborations
- 4.6.3 New Product Launches
- 4.6.4 Expansion Plans and funding
Chapter 5 Market Estimates & Forecast, By Business Model, 2021 - 2034 ($Bn, Fleet Size)
- 5.1 Key trends
- 5.2 B2C
- 5.3 B2B
- 5.4 P2P
Chapter 6 Market Estimates & Forecast, By Application, 2021 - 2034 ($Bn, Fleet Size)
- 6.1 Key trends
- 6.2 Android
- 6.3 IOS
- 6.4 Others
Chapter 7 Market Estimates & Forecast, By Transportation, 2021 - 2034 ($Bn, Fleet Size)
- 7.1 Key trends
- 7.2 Private
- 7.3 Public
Chapter 8 Market Estimates & Forecast, By Payment, 2021 - 2034 ($Bn, Fleet Size)
- 8.1 Key trends
- 8.2 Pay-per-Use
- 8.3 Monthly subscription
- 8.4 Corporate packages
- 8.5 Freemium models
Chapter 9 Market Estimates & Forecast, By Solution, 2021 - 2034 ($Bn, Fleet Size)
- 9.1 Key trends
- 9.2 Technology platforms
- 9.3 Payment engines
- 9.4 Navigation solutions
- 9.5 Telecom connectivity providers
- 9.6 Insurance services
Chapter 10 Market Estimates & Forecast, By Services, 2021 - 2034 ($Bn, Fleet Size)
- 10.1 Key trends
- 10.2 Ride hailing
- 10.3 Car sharing
- 10.4 Micro mobility
- 10.5 Bus sharing
- 10.6 Train services
Chapter 11 Market Estimates & Forecast, By Requirement, 2021 - 2034 ($Bn, Fleet Size)
- 11.1 Key trends
- 11.2 Daily commuter
- 11.3 First & last mile connectivity
- 11.4 Airport or mass transit stations trips
- 11.5 Off-peak & shift work commute
- 11.6 Inter-city trips
- 11.7 Others
Chapter 12 Market Estimates & Forecast, By Countries, 2021 - 2034 ($Bn, Fleet Size)
- 12.1 Key trends
- 12.2 China
- 12.3 Japan
- 12.4 India
- 12.5 South Korea
- 12.6 Australia
- 12.7 New Zealand
- 12.8 Indonesia
- 12.9 Malaysia
- 12.10 Singapore
- 12.11 Thailand
- 12.12 Vietnam
- 12.13 Cambodia
Chapter 13 Company Profiles
- 13.1 Baidu
- 13.2 BlueSG
- 13.3 Caocao
- 13.4 DiDi Chuxing
- 13.5 Drivemate
- 13.6 Fyn Mobility
- 13.7 GetGo
- 13.8 GoTo
- 13.9 Grab
- 13.10 Meituan
- 13.11 MobilityX
- 13.12 Moovit
- 13.13 MuvMi
- 13.14 Ola
- 13.15 Oyika
- 13.16 Pony
- 13.17 Sun Mobility
- 13.18 Uber
- 13.19 WeRide
- 13.20 Xanh SM

