
PUBLISHER: Global Market Insights Inc. | PRODUCT CODE: 1833396

PUBLISHER: Global Market Insights Inc. | PRODUCT CODE: 1833396
North America Barge Transportation Market Opportunity, Growth Drivers, Industry Trend Analysis, and Forecast 2025 - 2034
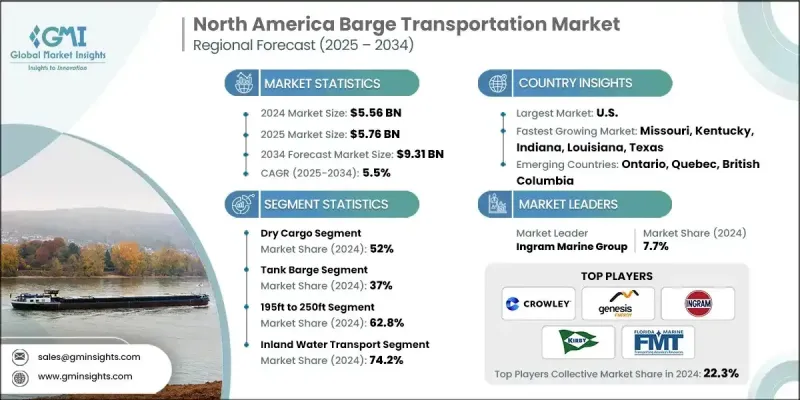
The North America Barge Transportation Market was valued at USD 5.56 billion in 2024 and is estimated to grow at a CAGR of 5.5% to reach USD 9.31 billion by 2034.
Barge transportation remains a cost-effective and efficient mode for moving bulk commodities like coal, grain, petroleum, and chemicals across inland waterways, driving steady demand throughout North America. Due to their large cargo capacity and low fuel consumption per mile, barges offer a significantly more economical solution compared to rail or truck transport-particularly for long-distance hauls of non-perishable goods.
| Market Scope | |
|---|---|
| Start Year | 2024 |
| Forecast Year | 2025-2034 |
| Start Value | $5.56 Billion |
| Forecast Value | $9.31 Billion |
| CAGR | 5.5% |
Rising Use of Dry Cargo
The dry cargo segment held a notable share in 2024, driven by bulk commodities such as grains, coal, ores, and construction materials. This segment benefits from the cost-effectiveness and capacity of barges, making it an ideal choice for transporting heavy and non-perishable goods across inland waterways. The efficient movement of dry cargo supports vital industries, including agriculture and manufacturing, where timely delivery is critical to operational continuity.
Tank Barge to Gain Traction
The tank barge segment held a significant share in 2024, driven by petroleum, chemicals, and refined fuels along North America's extensive waterway network. Tank barges offer a safer and more economical alternative to road and rail for hazardous and high-volume liquids, reducing environmental risks and costs. Demand in this segment is closely linked to the energy sector, particularly with growing exports of refined petroleum products. Industry leaders are investing in eco-friendly vessels equipped with advanced safety features and implementing stringent compliance standards to meet evolving regulatory requirements, thus enhancing their market position and customer trust.
Rising Adoption of Inland Water Transport
The inland water transport segment generated substantial revenues in 2024, backed by the vast network of rivers, canals, and lakes to connect major industrial and agricultural hubs. This segment offers an energy-efficient and environmentally friendly mode of freight movement that reduces road congestion and lowers greenhouse gas emissions. Increasing investments in infrastructure upgrades and digital logistics management are enhancing the capacity and responsiveness of inland water transport services. Companies are prioritizing partnerships with port authorities and shippers to expand service coverage and improve supply chain integration, positioning themselves as indispensable players in the regional transport ecosystem.
U.S. to Emerge as a Lucrative Region
U.S. barge transportation market will grow at a decent CAGR during 2025-2034, driven by its strategic inland waterways and diverse cargo demands. The Mississippi River system, Great Lakes, and other key waterways facilitate the movement of commodities critical to the nation's economy. Operators in this market are leveraging technological innovations such as automated tracking, fuel-efficient propulsion systems, and predictive maintenance to enhance operational efficiency.
Major players in the barge transportation market are Genesis Energy, Campbell Transportation Company, Florida Marine Transporters (FMT), Kirby Corporation, Tidewater, Crowley Maritime, Magnolia Marine Transport Company, American Commercial Barge Line (ACBL), and Ingram Marine.
To strengthen their market presence, companies in the North America barge transportation market are focusing on fleet modernization, incorporating environmentally friendly technologies to meet stricter emission standards. Strategic investments in digital tools, including real-time tracking and logistics optimization platforms, are improving service reliability and customer satisfaction.
Table of Contents
Chapter 1 Methodology
- 1.1 Market scope and definition
- 1.2 Research design
- 1.2.1 Research approach
- 1.2.2 Data collection methods
- 1.3 Data mining sources
- 1.3.1 Regional/Country
- 1.4 Base estimates and calculations
- 1.4.1 Base year calculation
- 1.4.2 Key trends for market estimation
- 1.5 Primary research and validation
- 1.5.1 Primary sources
- 1.6 Forecast model
- 1.7 Research assumptions and limitations
Chapter 2 Executive Summary
- 2.1 Industry 3600 synopsis, 2021 - 2034
- 2.2 Key market trends
- 2.2.1 Regional
- 2.2.2 Cargo
- 2.2.3 Barge fleet
- 2.2.4 Size
- 2.2.5 Barging activity
- 2.2.6 Application
- 2.3 TAM Analysis, 2025-2034
- 2.4 CXO perspectives: Strategic imperatives
- 2.4.1 Executive decision points
- 2.4.2 Critical success factors
- 2.5 Future outlook
- 2.6 Strategic recommendations
- 2.6.1 Supply chain diversification strategy
- 2.6.2 Product portfolio enhancement
- 2.6.3 Partnership and alliance opportunities
- 2.6.4 Cost management and pricing strategy
Chapter 3 Industry Insights
- 3.1 Industry ecosystem analysis
- 3.1.1 Supplier landscape
- 3.1.2 Profit margin analysis
- 3.1.3 Cost structure
- 3.1.4 Value addition at each stage
- 3.1.5 Factor affecting the value chain
- 3.1.6 Disruptions
- 3.2 Industry impact forces
- 3.2.1 Growth drivers
- 3.2.1.1 Agricultural & Industrial Demand
- 3.2.1.2 Cost Efficiency
- 3.2.1.3 Extensive Waterway Infrastructure
- 3.2.1.4 Environmental Sustainability
- 3.2.1.5 Regulatory & Safety Support
- 3.2.2 Industry pitfalls and challenges
- 3.2.2.1 Seasonal Waterway Limitations
- 3.2.2.2 Infrastructure Bottlenecks
- 3.2.3 Market opportunities
- 3.2.3.1 Expansion of Industrial & Petrochemical Hubs
- 3.2.3.2 Fleet Modernization & Digitalization
- 3.2.3.3 Green & Sustainable Logistics
- 3.2.3.4 Infrastructure Investments & Marine Highways
- 3.2.1 Growth drivers
- 3.3 Technology & Digital Transformation
- 3.3.1 Fleet Management & Tracking Systems
- 3.3.1.1 GPS Tracking & Real-Time Location Services
- 3.3.1.2 Automated Identification Systems (AIS)
- 3.3.1.3 Electronic Logging & Documentation
- 3.3.1.4 Predictive Analytics & Route Optimization
- 3.3.2 Cargo Monitoring & Visibility Solutions
- 3.3.2.1 RFID & Sensor Technology Integration
- 3.3.2.2 Temperature & Environmental Monitoring
- 3.3.2.3 Security & Theft Prevention Systems
- 3.3.2.4 Customer Portal & Shipment Tracking
- 3.3.3 Terminal Automation & Efficiency
- 3.3.3.1 Automated Loading & Unloading Systems
- 3.3.3.2 Inventory Management & Tracking
- 3.3.3.3 Equipment Scheduling & Optimization
- 3.3.3.4 Digital Documentation & Paperless Operations
- 3.3.4 Predictive Maintenance & Asset Management
- 3.3.4.1 Condition Monitoring & Diagnostics
- 3.3.4.2 Maintenance Scheduling Optimization
- 3.3.4.3 Parts Inventory & Supply Chain Management
- 3.3.4.4 Asset Performance Analytics & Reporting
- 3.3.1 Fleet Management & Tracking Systems
- 3.4 Transit Time Analysis & Route Optimization
- 3.4.1 Average Transit Times by Major Trade Routes
- 3.4.2 Seasonal Variations & Weather Impact on Schedules
- 3.4.3 Lock & Dam Delay Analysis & Congestion Patterns
- 3.4.4 Route Efficiency & Distance Optimization
- 3.5 Reliability & On-Time Performance Metrics
- 3.5.1 Schedule Adherence Rates by Operator & Route
- 3.5.2 Weather-Related Delay Statistics
- 3.5.3 Infrastructure-Related Service Disruptions
- 3.5.4 Customer Satisfaction & Service Quality Ratings
- 3.6 Capacity Utilization & Asset Management
- 3.6.1 Barge Utilization Rates by Fleet & Season
- 3.6.2 Load Factor Analysis by Commodity Type
- 3.6.3 Empty Positioning & Deadhead Miles
- 3.6.4 Fleet Deployment Optimization Strategies
- 3.7 Safety Performance & Risk Management
- 3.7.1 Accident Rates & Incident Analysis by Waterway
- 3.7.2 Cargo Damage & Loss Statistics
- 3.7.3 Environmental Spill Prevention & Response
- 3.7.4 Insurance Claims & Liability Management
- 3.8 Risk Assessment & Management
- 3.9 Growth potential analysis
- 3.10 Regulatory landscape
- 3.11 Porter’s analysis
- 3.12 PESTEL analysis
- 3.13 Patent analysis
- 3.14 Price trends
- 3.14.1 By region
- 3.14.2 By type
- 3.15 Use cases
- 3.16 Best-case scenario
- 3.17 North American Inland Waterway System Overview
- 3.18 Infrastructure Condition & Capacity Constraints Analysis
- 3.19 Environmental Standards & Sustainability Requirements
- 3.20 Investment Patterns & Infrastructure Modernization
- 3.21 Supply Chain Integration & Logistics Optimization
- 3.22 Modal Competition Analysis (Barge vs Rail vs Truck)
- 3.23 Economic Impact & Trade Facilitation Benefits
- 3.24 Weather Patterns & Seasonal Navigation Analysis
- 3.25 Labor Market Dynamics & Workforce Challenges
- 3.26 Insurance & Risk Management Framework
- 3.27 Cost Analysis
- 3.27.1 Transportation Cost Structure Analysis
- 3.27.2 Fuel Costs & Consumption Rates by Barge Type
- 3.27.3 Labor Costs & Crew Expense Analysis
- 3.27.4 Maintenance & Repair Cost Components
- 3.27.5 Insurance & Risk Management Costs
- 3.28 Sustainability and environmental aspects
- 3.28.1 Sustainable practices
- 3.28.2 Waste reduction strategies
- 3.28.3 Energy efficiency in production
- 3.28.4 Eco-friendly initiatives
- 3.28.5 Carbon footprint considerations
Chapter 4 Competitive Landscape, 2024
- 4.1 Introduction
- 4.2 Company market share analysis
- 4.2.1 US
- 4.2.2 Canada
- 4.3 Competitive analysis of major market players
- 4.4 Competitive positioning matrix
- 4.5 Strategic outlook matrix
- 4.6 Emerging competitive threats
- 4.6.1 New market entrants
- 4.6.2 Technology disruptors
- 4.6.3 Alternative business models
- 4.6.4 Competitive intelligence framework
- 4.7 Key news and initiatives
- 4.7.1 Mergers & acquisitions
- 4.7.2 Partnerships & collaborations
- 4.7.3 New product launches
- 4.7.4 Expansion plans and funding
Chapter 5 Market Estimates & Forecast, By Cargo, 2021 - 2034 ($Mn, Units)
- 5.1 Key trends
- 5.2 Liquid cargo
- 5.3 Gaseous cargo
- 5.4 Dry cargo
Chapter 6 Market Estimates & Forecast, By Barge fleet, 2021 - 2034 ($Mn, Units)
- 6.1 Key trends
- 6.2 Covered barge
- 6.3 Opened barge
- 6.4 Tank barge
Chapter 7 Market Estimates & Forecast, By Size, 2021 - 2034 ($Mn, Units)
- 7.1 Key trends
- 7.2 140ft to 180ft
- 7.3 195ft to 250ft
- 7.4 260ft to 300ft
- 7.5 300ft and above
Chapter 8 Market Estimates & Forecast, By Barging Activity, 2021 - 2034 ($Mn, Units)
- 8.1 Key trends
- 8.2 Intracoastal transportation
- 8.3 Inland water transport
Chapter 9 Market Estimates & Forecast, By Application, 2021 - 2034 ($Mn, Units)
- 9.1 Key trends
- 9.2 Coal
- 9.3 Crude & petroleum products
- 9.4 Liquid chemicals
- 9.5 Food pulp & other liquid
- 9.6 Agricultural products
- 9.7 Metal ores and fabricated metal products
- 9.8 Pharmaceuticals
- 9.9 Dry & gaseous chemicals
- 9.10 LPG, CNG, and other gaseous products
- 9.11 Electronics & digital equipment
- 9.12 Others
Chapter 10 Market Estimates & Forecast, By Region, 2021 - 2034 ($Mn, Units)
- 10.1 Key trends
- 10.2 US
- 10.2.1 Northeast US
- 10.2.1.1 Connecticut
- 10.2.1.2 Maine
- 10.2.1.3 Massachusetts
- 10.2.1.4 New Hampshire
- 10.2.1.5 New Jersey
- 10.2.1.6 New York
- 10.2.1.7 Pennsylvania
- 10.2.1.8 Rhode Island
- 10.2.1.9 Vermont
- 10.2.2 Midwest US
- 10.2.2.1 Illinois
- 10.2.2.2 Indiana
- 10.2.2.3 Iowa
- 10.2.2.4 Kansas
- 10.2.2.5 Michigan
- 10.2.2.6 Minnesota
- 10.2.2.7 Missouri
- 10.2.2.8 Nebraska
- 10.2.2.9 North Dakota
- 10.2.2.10 Ohio
- 10.2.2.11 South Dakota
- 10.2.2.12 Wisconsin
- 10.2.3 South US
- 10.2.3.1 Alabama
- 10.2.3.2 Arkansas
- 10.2.3.3 Delaware
- 10.2.3.4 Florida
- 10.2.3.5 Georgia
- 10.2.3.6 Kentucky
- 10.2.3.7 Louisiana
- 10.2.3.8 Maryland
- 10.2.3.9 Mississippi
- 10.2.3.10 North Carolina
- 10.2.3.11 Oklahoma
- 10.2.3.12 South Carolina
- 10.2.3.13 Tennessee
- 10.2.3.14 Texas
- 10.2.3.15 Virginia
- 10.2.3.16 West Virginia
- 10.2.3.17 Washington D.C.
- 10.2.4 West US
- 10.2.4.1 Alaska
- 10.2.4.2 Arizona
- 10.2.4.3 California
- 10.2.4.4 Colorado
- 10.2.4.5 Hawaii
- 10.2.4.6 Idaho
- 10.2.4.7 Montana
- 10.2.4.8 Nevada
- 10.2.4.9 New Mexico
- 10.2.4.10 Oregon
- 10.2.4.11 Utah
- 10.2.4.12 Washington
- 10.2.4.13 Wyoming
- 10.2.1 Northeast US
- 10.3 Canada
- 10.3.1 Alberta
- 10.3.2 British Columbia
- 10.3.3 Manitoba
- 10.3.4 New Brunswick
- 10.3.5 Newfoundland and Labrador
- 10.3.6 Nova Scotia
- 10.3.7 Ontario
- 10.3.8 Prince Edward Island
- 10.3.9 Quebec
- 10.3.10 Saskatchewan
Chapter 11 Company Profiles
- 11.1 Global Players
- 11.1.1 Ingram Corporation
- 11.1.2 American Commercial Barge Line (ACBL)
- 11.1.3 Kirby Corporation
- 11.1.4 ARTCO Fleet
- 11.1.5 Campbell Transportation Company
- 11.1.6 Marquette Transportation Company
- 11.1.7 Waterways Transportation
- 11.1.8 Canal Barge Company
- 11.1.9 American Steamship Company
- 11.1.10 Foss Maritime
- 11.2 Regional Players
- 11.2.1 American River Transportation
- 11.2.2 Golding Barge Line
- 11.2.3 Crescent Towing
- 11.2.4 Parker Towing Company
- 11.2.5 Serodino
- 11.2.6 McKeil Marine
- 11.2.7 Groupe Desgagnes
- 11.2.8 Algoma Central Corporation
- 11.2.9 Great Lakes Fleet
- 11.2.10 Interlake Steamship Company
- 11.3 Emerging Players & Disruptors
- 11.3.1 Fleet Nav
- 11.3.2 Blessey Marine Services
- 11.3.3 Brennan Marine
- 11.3.4 Savage Inland Marine
- 11.3.5 OSG America

