
PUBLISHER: Global Market Insights Inc. | PRODUCT CODE: 1833416

PUBLISHER: Global Market Insights Inc. | PRODUCT CODE: 1833416
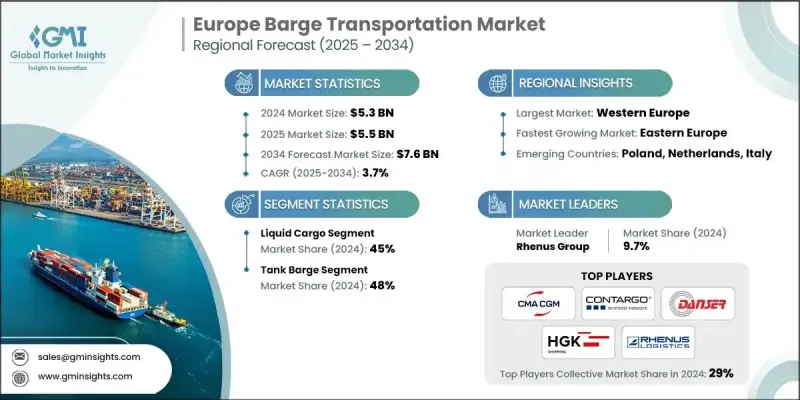
Europe Barge Transportation Market Opportunity, Growth Drivers, Industry Trend Analysis, and Forecast 2025 - 2034
The Europe Barge Transportation Market was valued at USD 5.3 billion in 2024 and is estimated to grow at a CAGR of 3.7% to reach USD 7.6 billion by 2034.
Barge transportation is recognized as one of the most cost-effective and fuel-efficient modes of cargo movement in Europe, particularly for bulk goods such as coal, grains, and chemicals. Compared to road and rail transportation, barges can carry large quantities of goods at a lower cost, making them an attractive option for industries looking to reduce logistics expenses.
| Market Scope | |
|---|---|
| Start Year | 2024 |
| Forecast Year | 2025-2034 |
| Start Value | $5.3 Billion |
| Forecast Value | $7.6 Billion |
| CAGR | 3.7% |
Rising Adoption of Liquid Cargo
The liquid cargo segment held a significant share in 2024, backed by crude oil, petroleum products, chemicals, and liquid fertilizers. Barges are particularly well-suited for transporting large volumes of liquid cargo, offering both efficiency and cost-effectiveness compared to other transportation modes like trucks or trains. This segment benefits from Europe's vast network of navigable rivers, canals, and coastal routes, which allows for seamless transportation across countries.
Tank Barge to Gain Traction
The tank barge segment generated a sizeable share in 2024. These barges, specifically designed for transporting hazardous materials and bulk liquids, offer high capacity and safety standards required for such cargo types. With the increasing need for energy, chemicals, and industrial goods, demand for tank barges is rising, particularly for transporting petroleum products and liquefied natural gas (LNG).
Western Europe to Emerge as a Lucrative Region
Western Europe barge transportation market held a robust share in 2024. Countries like Germany, France, the Netherlands, and Belgium lead the market, with an extensive network of navigable rivers and canals that provide a cost-effective alternative to road and rail transport. Western Europe's position as an industrial powerhouse, with manufacturing, energy, and agriculture being key drivers, fuels the demand for bulk cargo transportation, including liquid goods, construction materials, and agricultural products
Major players in the Europe barge transportation market are HGK Shipping, Sogestran / CFT, Imperial Logistics International, Van den Bosch Transporten, Rhenus, Stolt-Nielsen Inland Tanker Service, Contargo, Danser, Deutsche Binnenreederei, and CMA CGM.
To maintain and strengthen their foothold in the Europe barge transportation market, companies are focusing on technological innovations, expansion of fleet capacities, and improved safety standards. Many firms are adopting digital technologies such as IoT systems to optimize fleet management, reduce fuel consumption, and improve operational efficiency. Additionally, companies are increasing investments in environmentally friendly solutions, such as eco-friendly barges that comply with stringent EU environmental regulations. Strategic partnerships and collaborations are also key to expanding reach, as operators look to integrate services across different regions of Europe, creating a seamless multimodal transport network.
Table of Contents
Chapter 1 Methodology
- 1.1 Market scope and definition
- 1.2 Research design
- 1.2.1 Research approach
- 1.2.2 Data collection methods
- 1.3 Data mining sources
- 1.3.1 Regional/Country
- 1.4 Base estimates and calculations
- 1.4.1 Base year calculation
- 1.4.2 Key trends for market estimation
- 1.5 Primary research and validation
- 1.5.1 Primary sources
- 1.6 Forecast model
- 1.7 Research assumptions and limitations
Chapter 2 Executive Summary
- 2.1 Industry 3600 synopsis, 2021 - 2034
- 2.2 Key market trends
- 2.2.1 Regional
- 2.2.2 Cargo
- 2.2.3 Barge Fleet
- 2.2.4 Barging Activity
- 2.2.5 Size
- 2.2.6 Application
- 2.3 TAM Analysis, 2025-2034
- 2.4 CXO perspectives: Strategic imperatives
- 2.4.1 Executive decision points
- 2.4.2 Critical success factors
- 2.5 Future outlook and strategic recommendations
Chapter 3 Industry Insights
- 3.1 Industry ecosystem analysis
- 3.1.1 Supplier landscape
- 3.1.2 Profit margin analysis
- 3.1.3 Cost structure
- 3.1.4 Value addition at each stage
- 3.1.5 Factor affecting the value chain
- 3.1.6 Disruptions
- 3.2 Industry impact forces
- 3.2.1 Growth drivers
- 3.2.1.1 Rising demand for inland and coastal logistics
- 3.2.1.2 Environmental regulations and decarbonization policies
- 3.2.1.3 Growth of chemical, petroleum, and agricultural cargo
- 3.2.1.4 Expansion of EU trade and cross-border waterways
- 3.2.1.5 Adoption of larger and specialized barges
- 3.2.2 Industry pitfalls and challenges
- 3.2.2.1 Aging barge fleets in some regions
- 3.2.2.2 Infrastructure limitations in smaller waterways
- 3.2.3 Market opportunities
- 3.2.3.1 Fleet modernization and upscaling
- 3.2.3.2 Diversification of cargo
- 3.2.3.3 Development of European inland waterway corridors
- 3.2.3.4 Integration of digital tracking and automation
- 3.2.1 Growth drivers
- 3.3 Growth potential analysis
- 3.4 Regulatory landscape
- 3.5 Porter’s analysis
- 3.6 PESTEL analysis
- 3.7 Price trends
- 3.7.1 By region
- 3.7.2 By product
- 3.8 Production statistics
- 3.8.1 Production hubs
- 3.8.2 Consumption hubs
- 3.8.3 Export and import
- 3.9 Cost breakdown analysis
- 3.10 Patent analysis
- 3.11 Fleet composition and vessel technology analysis
- 3.11.1 Barge fleet characteristics and specifications
- 3.11.1.1 Vessel size and capacity analysis
- 3.11.1.2 Cargo-specific barge design and configuration
- 3.11.1.3 Age profile and fleet modernization needs
- 3.11.1.4 Ownership structure and fleet management
- 3.11.2 Propulsion and navigation technology
- 3.11.2.1 Engine technology and fuel efficiency
- 3.11.2.2 Navigation and communication systems
- 3.11.2.3 Automation and remote monitoring capabilities
- 3.11.2.4 Safety and emergency response systems
- 3.11.3 Cargo handling and loading systems
- 3.11.3.1 Specialized cargo handling equipment
- 3.11.3.2 Loading and unloading efficiency systems
- 3.11.3.3 Cargo securing and safety systems
- 3.11.3.4 Environmental protection and containment
- 3.11.4 Fleet optimization and capacity management
- 3.11.4.1 Route optimization and scheduling systems
- 3.11.4.2 Capacity utilization and load factor analysis
- 3.11.4.3 Maintenance and lifecycle management
- 3.11.4.4 Fleet expansion and investment planning
- 3.11.1 Barge fleet characteristics and specifications
- 3.12 Cost structure and pricing analysis
- 3.12.1 Operating cost components and structure
- 3.12.1.1 Fuel costs and energy efficiency (30-40%)
- 3.12.1.2 Crew and labor costs (20-25%)
- 3.12.1.3 Maintenance and repair costs (15-20%)
- 3.12.1.4 Insurance and regulatory compliance (8-12%)
- 3.12.1.5 Port charges and navigation fees (5-10%)
- 3.12.2 Capital investment and asset utilization
- 3.12.2.1 Vessel acquisition and financing costs
- 3.12.2.2 Infrastructure investment requirements
- 3.12.2.3 Asset utilization and return on investment
- 3.12.2.4 Depreciation and asset lifecycle management
- 3.12.3 Pricing models and revenue optimization
- 3.12.3.1 Freight rate structures and pricing mechanisms
- 3.12.3.2 Contract vs spot market pricing
- 3.12.3.3 Volume discounts and long-term agreements
- 3.12.3.4 Fuel surcharge and cost pass-through mechanisms
- 3.12.4 Competitive pricing and market positioning
- 3.12.4.1 Price comparison with alternative transport modes
- 3.12.4.2 Value proposition and service differentiation
- 3.12.4.3 Market pricing trends and elasticity
- 3.12.4.4 Competitiveness and efficiency gains
- 3.12.1 Operating cost components and structure
- 3.13 Technology & innovation landscape
- 3.13.1 Current technology adoption
- 3.13.1.1 Digital platform development and integration
- 3.13.1.2 Automation and process optimization
- 3.13.1.3 Data analytics and business intelligence
- 3.13.1.4 Cloud computing and system integration
- 3.13.2 Emerging technologies and innovation trends
- 3.13.2.1 Internet of things (IoT) and sensor networks
- 3.13.2.2 Artificial intelligence and machine learning
- 3.13.2.3 Blockchain and distributed ledger technology
- 3.13.2.4 Autonomous vessel technology development
- 3.13.3 Communication and connectivity solutions
- 3.13.3.1 Satellite communication and tracking systems
- 3.13.3.2 Mobile and wireless connectivity
- 3.13.3.3 Real-time data exchange and integration
- 3.13.3.4 Customer communication and service platforms
- 3.13.4 Innovative investment and technology partnerships
- 3.13.4.1 R&D investment and technology development
- 3.13.4.2 Technology partnership and collaboration
- 3.13.4.3 Startup ecosystem and innovation hubs
- 3.13.4.4 Government support and innovation programs
- 3.13.1 Current technology adoption
- 3.14 Sustainability and environmental aspects
- 3.14.1 Sustainable practices
- 3.14.2 Waste reduction strategies
- 3.14.3 Energy efficiency in production
- 3.14.4 Eco-friendly Initiatives
- 3.14.5 Carbon footprint considerations
Chapter 4 Competitive Landscape, 2024
- 4.1 Introduction
- 4.2 Company market share analysis
- 4.2.1 Northern Europe
- 4.2.2 Western Europe
- 4.2.3 Southern Europe
- 4.2.4 Eastern Europe
- 4.3 Competitive analysis of major market players
- 4.4 Competitive positioning matrix
- 4.5 Strategic outlook matrix
- 4.6 Key developments
- 4.6.1 Mergers & acquisitions
- 4.6.2 Partnerships & collaborations
- 4.6.3 New Product Launches
- 4.6.4 Expansion Plans and funding
Chapter 5 Market Estimates & Forecast, By Cargo, 2021 - 2034 ($Bn, Million tons)
- 5.1 Key trends
- 5.2 Liquid cargo
- 5.3 Gaseous cargo
- 5.4 Dry cargo
Chapter 6 Market Estimates & Forecast, By Barge Fleet, 2021 - 2034 ($Bn, Million tons)
- 6.1 Key trends
- 6.2 Covered barge
- 6.3 Opened barge
- 6.4 Tank barge
Chapter 7 Market Estimates & Forecast, By Barging Activity, 2021 - 2034 ($Bn, Million tons)
- 7.1 Key trends
- 7.2 Intracoastal transportation
- 7.3 Inland water transport
Chapter 8 Market Estimates & Forecast, By Size, 2021 - 2034 ($Bn, Million tons)
- 8.1 Key trends
- 8.2 140ft to 180ft
- 8.3 195ft to 250ft
- 8.4 260ft to 300ft
- 8.5 300ft and above
Chapter 9 Market Estimates & Forecast, By Application, 2021 - 2034 ($Bn, Million tons)
- 9.1 Key trends
- 9.2 Coal
- 9.3 Crude & petroleum products
- 9.4 Liquid chemicals
- 9.5 Food pulp & other liquid
- 9.6 Agricultural products
- 9.7 Metal ores and fabricated metal products
- 9.8 Pharmaceuticals
- 9.9 Dry & gaseous chemicals
- 9.10 LPG, CNG, and other gaseous products
- 9.11 Electronics & digital equipment
- 9.12 Others
Chapter 10 Market Estimates & Forecast, By Region, 2021 - 2034 ($Bn, Million tons)
- 10.1 Key trends
- 10.2 Western Europe
- 10.2.1 Germany
- 10.2.2 France
- 10.2.3 Netherlands
- 10.2.4 Belgium
- 10.2.5 Switzerland
- 10.2.6 Austria
- 10.2.7 Luxembourg
- 10.2.8 Liechtenstein
- 10.2.9 Ireland
- 10.3 Eastern Europe
- 10.3.1 Poland
- 10.3.2 Czech Republic
- 10.3.3 Portugal
- 10.3.4 Serbia
- 10.3.5 Albania
- 10.3.6 Slovakia
- 10.3.7 Romania
- 10.3.8 Slovenia
- 10.3.9 Bulgaria
- 10.3.10 Estonia
- 10.4 Northern Europe
- 10.4.1 UK
- 10.4.2 Denmark
- 10.4.3 Sweden
- 10.4.4 Norway
- 10.4.5 Iceland
- 10.4.6 Faroe Islands
- 10.5 Southern Europe
- 10.5.1 Italy
- 10.5.2 Spain
- 10.5.3 Vatican City
- 10.5.4 San Marino
- 10.5.5 Greece
- 10.5.6 Cyprus
Chapter 11 Company Profiles
- 11.1 Global Players
- 11.1.1 CMA CGM
- 11.1.2 Imperial Logistics International
- 11.1.3 Rhenus
- 11.1.4 Sogestran / CFT
- 11.1.5 Stolt-Nielsen Inland Tanker Service
- 11.1.6 Van den Bosch Transporten
- 11.1.7 DP World
- 11.1.8 Swire Bulk Europe
- 11.1.9 VTG
- 11.1.10 Cobelfret Barge
- 11.2 Regional Players
- 11.2.1 Contargo
- 11.2.2 Danser
- 11.2.3 HGK Shipping
- 11.2.4 Deutsche Binnenreederei
- 11.2.5 Blue Line Logistics
- 11.2.6 PortLiner
- 11.2.7 AWT
- 11.2.8 Planco Shipping
- 11.2.9 De Poli Tankers
- 11.2.10 Danubia Krems

