
PUBLISHER: Global Market Insights Inc. | PRODUCT CODE: 1871127

PUBLISHER: Global Market Insights Inc. | PRODUCT CODE: 1871127
Sodium-Ion Battery Chemicals Market Opportunity, Growth Drivers, Industry Trend Analysis, and Forecast 2025 - 2034
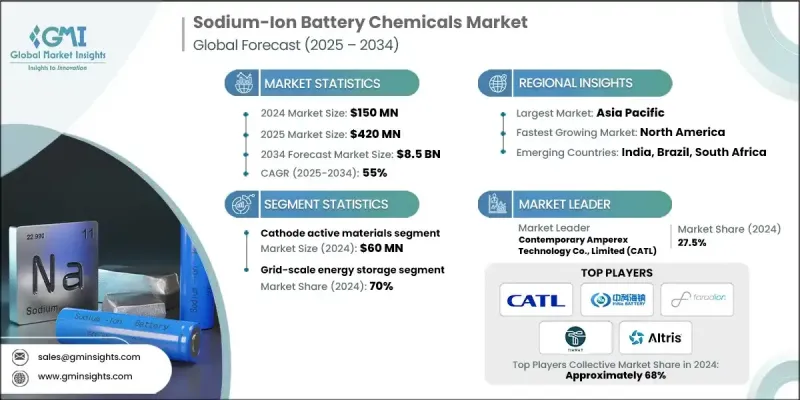
The Global Sodium-Ion Battery Chemicals Market was valued at USD 150 million in 2024 and is estimated to grow at a CAGR of 55% to reach USD 8.5 Billion by 2034.
The market's rapid growth is fueled by the cost-effectiveness of sodium-ion systems, which rely on abundant, cobalt-free materials and optimized electrolyte-cathode pairings. Industrial and grid-scale users prioritize cost per kilowatt-hour, cycle life, and safety, which makes sodium-ion chemistry particularly attractive in these sectors. Mobility applications remain cautious due to volumetric energy constraints, with wider adoption expected once energy densities surpass 200 Wh/kg. Regional policies also play a key role: the EU emphasizes recyclability and end-of-life management, supporting sodium-heavy chemistries, while China's industrial strategy under the 14th Five-Year Plan accelerates domestic pilots and materials scale-up. Grid-focused adoption ensures predictable demand for upstream chemicals, particularly electrolytes and additives, while performance improvements, cost reductions, and cathode innovations strengthen the market foothold in industrial, grid, and select mobility niches.
| Market Scope | |
|---|---|
| Start Year | 2024 |
| Forecast Year | 2025-2034 |
| Start Value | $150 Million |
| Forecast Value | $8.5 Billion |
| CAGR | 55% |
The cathode active materials segment generated USD 60 million in 2024. They hold the largest value share due to their critical role in energy density and lifecycle performance, while anode materials account for roughly 30%, with the remainder in supporting chemicals and other materials. Early-generation sodium-ion cells deliver about 175 Wh/kg, with advancements in sodium vanadium phosphate and NASICON cathodes expected to push energy density above 200 Wh/kg by 2027. Cathode innovation drives the greatest Wh/kg gains, while hard carbon anodes improve first-cycle efficiency and long-term capacity retention.
The grid-scale energy storage segment held a 70% share, valued at USD 105 million in 2024. Sodium-ion batteries offer cost-efficient and thermally safe solutions for renewable energy integration and load-leveling. Additionally, they are gaining traction in low-speed electric vehicles, where affordability and safety outweigh volumetric energy density requirements.
North America Sodium-Ion Battery Chemicals Market reached USD 18 million in 2024. Federal funding for R&D and commercialization, along with private capital investment targeting industrial and data center applications, are key growth drivers. Initiatives by U.S. government agencies funnel substantial resources into scaling alternative chemistries. Manufacturing projects, particularly in North Carolina and Michigan, highlight early adoption in industrial UPS, grid services, and telecom applications. North America benefits from a strong supplier ecosystem, while Canada leverages its domestic materials base and geographic advantages.
Key players in the Sodium-Ion Battery Chemicals Market include TIAMAT SAS, HiNa Battery Technology Co., Ltd., Altris AB, Contemporary Amperex Technology Co., Limited (CATL), Faradion (Reliance), and others. Companies are focusing on advancing cathode and anode chemistries to increase energy density and cycle life, aiming to make sodium-ion viable for mobility applications. Strategic partnerships with grid operators and industrial end-users help secure predictable demand and accelerate adoption. Firms are investing heavily in R&D to enhance electrolyte formulations and safety additives, which differentiate their offerings. Expanding manufacturing capacity and localizing production reduces supply chain risks and shortens time-to-market. Companies leverage government incentives and funding programs to accelerate commercialization and pilot projects. Collaborations with academic institutions and material suppliers support innovation. Additionally, marketing efforts emphasize safety, sustainability, and cost advantages to strengthen brand positioning and build customer trust across grid, industrial, and niche mobility segments.
Table of Contents
Chapter 1 Methodology
- 1.1 Market scope and definition
- 1.2 Research design
- 1.2.1 Research approach
- 1.2.2 Data collection methods
- 1.3 Data mining sources
- 1.3.1 Global
- 1.3.2 Regional/Country
- 1.4 Base estimates and calculations
- 1.4.1 Base year calculation
- 1.4.2 Key trends for market estimation
- 1.5 Primary research and validation
- 1.5.1 Primary sources
- 1.6 Forecast model
- 1.7 Research assumptions and limitations
Chapter 2 Executive Summary
- 2.1 Industry 360° synopsis
- 2.2 Key market trends
- 2.2.1 Regional
- 2.2.2 Active Material Type
- 2.2.3 Supporting Materials
- 2.2.4 Application
- 2.3 TAM Analysis, 2025-2034
- 2.4 CXO perspectives: Strategic imperatives
- 2.4.1 Executive decision points
- 2.4.2 Critical success factors
- 2.5 Future Outlook and Strategic Recommendations
Chapter 3 Industry Insights
- 3.1 Industry ecosystem analysis
- 3.1.1 Supplier Landscape
- 3.1.2 Profit Margin
- 3.1.3 Value addition at each stage
- 3.1.4 Factor affecting the value chain
- 3.1.5 Disruptions
- 3.2 Industry impact forces
- 3.2.1 Growth drivers
- 3.2.2 Industry pitfalls and challenges
- 3.2.2.1 Supply chain complexity
- 3.2.3 Market opportunities
- 3.3 Growth potential analysis
- 3.4 Regulatory landscape
- 3.4.1 North America
- 3.4.2 Europe
- 3.4.3 Asia Pacific
- 3.4.4 Latin America
- 3.4.5 Middle East & Africa
- 3.5 Porter's analysis
- 3.6 PESTEL analysis
- 3.7 Price trends
- 3.7.1 By region
- 3.7.2 By active material
- 3.8 Future market trends
- 3.9 Technology and Innovation landscape
- 3.9.1 Current technological trends
- 3.9.2 Emerging technologies
- 3.10 Patent Landscape
- 3.11 Trade statistics (Note: the trade statistics will be provided for key countries only)
- 3.11.1 Major importing countries
- 3.11.2 Major exporting countries
- 3.12 Sustainability and Environmental Aspects
- 3.12.1 Sustainable Practices
- 3.12.2 Waste Reduction Strategies
- 3.12.3 Energy Efficiency in Production
- 3.12.4 Eco-friendly Initiatives
- 3.13 Carbon Footprint Considerations
Chapter 4 Competitive Landscape, 2024
- 4.1 Introduction
- 4.2 Company market share analysis
- 4.2.1 By region
- 4.2.1.1 North America
- 4.2.1.2 Europe
- 4.2.1.3 Asia Pacific
- 4.2.1.4 LATAM
- 4.2.1.5 MEA
- 4.2.1 By region
- 4.3 Company matrix analysis
- 4.4 Competitive analysis of major market players
- 4.5 Competitive positioning matrix
- 4.6 Key developments
- 4.6.1 Mergers & acquisitions
- 4.6.2 Partnerships & collaborations
- 4.6.3 New Product Launches
- 4.6.4 Expansion Plans
Chapter 5 Market Estimates and Forecast, By Active Material Type, 2021- 2034 (USD Million, Kilo Tons)
- 5.1 Key trends
- 5.2 Cathode active materials
- 5.2.1 Layered transition metal oxides (TMLO)
- 5.2.2 NASICON-type materials
- 5.2.3 Prussian blue analogues (PBAs)
- 5.2.4 Polyanionic compounds
- 5.3 Anode active materials
- 5.3.1 Hard carbon materials
- 5.3.2 Biomass-derived hard carbon
- 5.3.3 Petroleum coke-derived hard carbon
- 5.3.4 Synthetic hard carbon
- 5.3.5 Titanium-based anode materials
- 5.3.6 Emerging anode materials
- 5.4 Others
Chapter 6 Market Estimates and Forecast, By Supporting Materials, 2021- 2034 (USD Million, Kilo Tons)
- 6.1 Key trends
- 6.2 Electrolyte materials
- 6.2.1 Sodium salts
- 6.2.2 Sodium perchlorate (NaClO4)
- 6.2.3 Advanced sodium salts
- 6.3 Organic solvents
- 6.3.1 Carbonate solvents (EC, DMC, PC, EMC)
- 6.3.2 Alternative solvent systems
- 6.4 Electrolyte additives
- 6.4.1 Film-forming additives (FEC, VC)
- 6.4.2 Specialized performance additives
- 6.5 Binder materials
- 6.5.1 Sodium carboxymethyl cellulose (Na-CMC)
- 6.5.2 Polyvinylidene fluoride (PVDF)
- 6.5.3 Alternative binder systems
- 6.6 Conductive additives
- 6.6.1 Carbon black
- 6.6.2 Advanced conductive materials
- 6.7 Other materials
Chapter 7 Market Estimates and Forecast, By Application, 2021 - 2034 (USD Million, Kilo Tons)
- 7.1 Key trends
- 7.2 Grid-scale energy storage applications
- 7.2.1 Utility-scale storage systems (>10 MW)
- 7.2.2 Renewable energy integration systems
- 7.2.3 EV fast charging infrastructure
- 7.3 Transportation applications
- 7.3.1 Electric vehicle systems
- 7.3.2 Specialized transportation
- 7.4 Industrial & commercial applications
- 7.4.1 Data center UPS systems
- 7.4.2 Industrial backup power
- 7.4.3 Telecommunications infrastructure
- 7.5 Other applications
Chapter 8 Market Estimates and Forecast, By Region, 2021 - 2034 (USD Million, Kilo Tons)
- 8.1 Key trends
- 8.2 North America
- 8.2.1 U.S.
- 8.2.2 Canada
- 8.3 Europe
- 8.3.1 Germany
- 8.3.2 UK
- 8.3.3 France
- 8.3.4 Italy
- 8.3.5 Spain
- 8.3.6 Rest of Europe
- 8.4 Asia Pacific
- 8.4.1 China
- 8.4.2 India
- 8.4.3 Japan
- 8.4.4 Australia
- 8.4.5 South Korea
- 8.4.6 Rest of Asia Pacific
- 8.5 Latin America
- 8.5.1 Brazil
- 8.5.2 Mexico
- 8.5.3 Argentina
- 8.5.4 Rest of Latin America
- 8.6 Middle East & Africa
- 8.6.1 Saudi Arabia
- 8.6.2 South Africa
- 8.6.3 UAE
- 8.6.4 Rest of Middle East & Africa
Chapter 9 Company Profiles
- 9.1 Contemporary Amperex Technology Co., Limited (CATL)
- 9.2 HiNa Battery Technology Co., Ltd.
- 9.3 Faradion Limited (acquired by Reliance Industries)
- 9.4 TIAMAT SAS
- 9.5 Altris AB
- 9.6 Kuraray Co., Ltd.
- 9.7 Sumitomo Bakelite Co., Ltd.
- 9.8 BTR New Material Group Co., Ltd.
- 9.9 Shengquan Group Co., Ltd.
- 9.10 Kureha Corporation
- 9.11 Tinci Materials Technology Co., Ltd.
- 9.12 DFD New Energy Materials Co., Ltd.
- 9.13 CAPCHEM Technology Co., Ltd.
- 9.14 YONGTA Chemical Technology Co., Ltd.
- 9.15 RTXC New Energy Technology Co., Ltd.
- 9.16 NGK Insulators, Ltd.
- 9.17 AMTE Power plc
- 9.18 MSE Supplies LLC
- 9.19 MTI
- 9.20 XTL Corporation
- 9.21 NATRIUM Energy Technology Co., Ltd.

