
PUBLISHER: Global Market Insights Inc. | PRODUCT CODE: 1876608

PUBLISHER: Global Market Insights Inc. | PRODUCT CODE: 1876608
Plastic Chemical Recycling Market Opportunity, Growth Drivers, Industry Trend Analysis, and Forecast 2025 - 2034
The Global Plastic Chemical Recycling Market was valued at USD 248.5 million in 2024 and is estimated to grow at a CAGR of 21.2% to reach USD 1.6 billion by 2034.
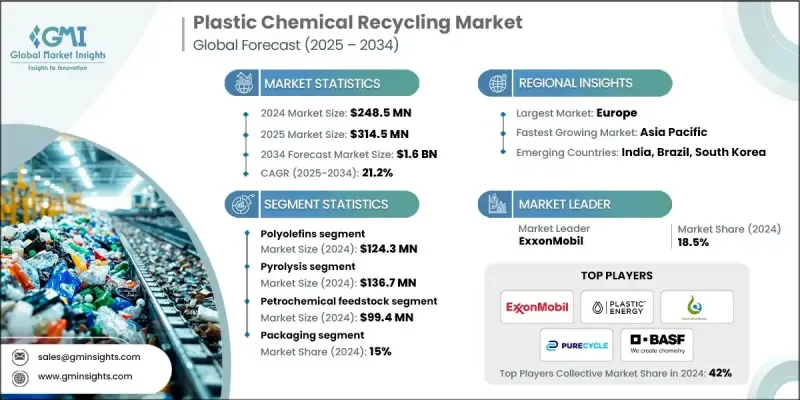
The industry is undergoing a major transformation as advanced recycling technologies gain momentum, enabling the conversion of mixed and contaminated plastics into high-value monomers, polymers, and fuels. This transition supports the global circular economy movement and reduces dependence on landfilling. Applications such as petrochemical feedstock and polymer manufacturing dominate the market, while fuel production is anticipated to rise as waste-to-energy initiatives gain traction. Additionally, specialized uses of recycled chemical feedstock are increasing, particularly in high-performance polymer production and additive manufacturing, as purification and dissolution methods become more refined. Europe remains the leading region, driven by strong regulatory frameworks, extended producer responsibility mandates, and the widespread integration of recycled content in multiple industries. The rapid adoption of advanced processes such as depolymerization, pyrolysis, and solvolysis has revolutionized the recycling of complex and contaminated plastic waste streams. Growing investments in research, pilot-to-commercial scaling, and public-private partnerships are accelerating this market's expansion. Governments and global petrochemical giants are also collaborating to integrate chemical recycling directly into existing production and supply chain ecosystems.
| Market Scope | |
|---|---|
| Start Year | 2024 |
| Forecast Year | 2025-2034 |
| Start Value | $248.5 Million |
| Forecast Value | $1.6 Billion |
| CAGR | 21.2% |
In 2024, the pyrolysis segment generated USD 136.7 million. Its ability to transform polyolefins and mixed plastic waste into valuable petrochemical feedstocks and fuels makes it the preferred recycling technology.
The polymer production accounted for a 30% share in 2024, supported by the packaging and textile industries' closed-loop recycling initiatives. The use of depolymerization and solvolysis techniques allows manufacturers to recover premium-grade monomers used to create new, high-quality polymers, driving sustainability in production.
U.S. Plastic Chemical Recycling Market was valued at USD 62.1 million in 2024, propelled by strong government support, heightened awareness of environmental responsibility, and well-established recycling infrastructure. The region is witnessing the rapid construction of advanced recycling facilities, with the growing adoption of pyrolysis and depolymerization systems. Key industries such as packaging, automotive, and electronics are leading in the use of recycled materials to achieve sustainability goals and reduce environmental impact.
Prominent players operating in the Global Plastic Chemical Recycling Market include Mura Technology Limited, Agilyx Corporation, Brightmark LLC, BASF SE, Evonik Industries AG, Nexus Circular LLC, INEOS Group, Plastic Energy Limited, Quantafuel ASA, Mitsubishi Chemical Group Corporation, Dow Inc., Shell plc, Versalis S.p.A. (Eni), Saudi Basic Industries Corporation (SABIC), Exxon Mobil Corporation, PureCycle Technologies, Inc., and BlueAlp Holding BV. Leading companies in the Plastic Chemical Recycling Market are focusing on expanding production capacity, forming strategic partnerships, and advancing proprietary technologies to strengthen their position. Many are scaling pilot projects to commercial operations to improve economic viability and process efficiency. Investments in pyrolysis, depolymerization, and solvolysis are increasing to boost recovery rates and the quality of recycled output.
Table of Contents
Chapter 1 Methodology & Scope
- 1.1 Market scope and definition
- 1.2 Research design
- 1.2.1 Research approach
- 1.2.2 Data collection methods
- 1.3 Data mining sources
- 1.3.1 Global
- 1.3.2 Regional/Country
- 1.4 Base estimates and calculations
- 1.4.1 Base year calculation
- 1.4.2 Key trends for market estimation
- 1.5 Primary research and validation
- 1.5.1 Primary sources
- 1.6 Forecast model
- 1.7 Research assumptions and limitations
Chapter 2 Executive Summary
- 2.1 Industry 360° synopsis
- 2.2 Key market trends
- 2.2.1 Regional
- 2.2.2 Feedstock type
- 2.2.3 Technology type
- 2.2.4 Application
- 2.2.5 End Use
- 2.3 TAM Analysis, 2025-2034
- 2.4 CXO perspectives: Strategic imperatives
- 2.4.1 Executive decision points
- 2.4.2 Critical success factors
- 2.5 Future Outlook and Strategic Recommendations
Chapter 3 Industry Insights
- 3.1 Industry ecosystem analysis
- 3.1.1 Supplier landscape
- 3.1.2 Profit margin
- 3.1.3 Value addition at each stage
- 3.1.4 Factor affecting the value chain
- 3.1.5 Disruptions
- 3.2 Industry impact forces
- 3.2.1 Growth drivers
- 3.2.2 Industry pitfalls and challenges
- 3.2.3 Market opportunities
- 3.3 Growth potential analysis
- 3.4 Regulatory landscape
- 3.4.1 North America
- 3.4.2 Europe
- 3.4.3 Asia Pacific
- 3.4.4 Latin America
- 3.4.5 Middle East & Africa (MEA)
- 3.5 Porter's analysis
- 3.6 PESTEL analysis
- 3.7 Price trends
- 3.7.1 By region
- 3.7.2 By feedstock type
- 3.8 Future market trends
- 3.9 Technology and innovation landscape
- 3.9.1 Current technological trends
- 3.9.2 Emerging technologies
- 3.10 Patent landscape
- 3.11 Trade statistics (HS code) (Note: the trade statistics will be provided for key countries only)
- 3.11.1 Major importing countries
- 3.11.2 Major exporting countries
- 3.12 Sustainability and environmental aspects
- 3.12.1 Sustainable practices
- 3.12.2 Waste reduction strategies
- 3.12.3 Energy efficiency in production
- 3.12.4 Eco-friendly initiatives
- 3.13 Carbon footprint consideration
Chapter 4 Competitive Landscape, 2024
- 4.1 Introduction
- 4.2 Company market share analysis
- 4.2.1 By region
- 4.2.1.1 North America
- 4.2.1.2 Europe
- 4.2.1.3 Asia Pacific
- 4.2.1.4 LATAM
- 4.2.1.5 MEA
- 4.2.1 By region
- 4.3 Company matrix analysis
- 4.4 Competitive analysis of major market players
- 4.5 Competitive positioning matrix
- 4.6 Key developments
- 4.6.1 Mergers & acquisitions
- 4.6.2 Partnerships & collaborations
- 4.6.3 New product launches
- 4.6.4 Expansion plans
Chapter 5 Market Estimates and Forecast, By Feedstock Type, 2021-2034 (USD Million & Tons)
- 5.1 Key trends
- 5.2 Polyolefins
- 5.2.1 Polyethylene (PE)
- 5.2.2 Polypropylene (PP)
- 5.3 Polyesters (PET)
- 5.4 Polystyrene (PS)
- 5.5 Mixed plastic waste
- 5.6 Others
Chapter 6 Market Estimates and Forecast, By Technology Type, 2021-2034 (USD Million & Tons)
- 6.1 Key trends
- 6.2 Pyrolysis
- 6.3 Gasification
- 6.4 Depolymerization
- 6.5 Solvolysis
- 6.6 Purification/dissolution
Chapter 7 Market Estimates and Forecast, By Application, 2021-2034 (USD Million & Tons)
- 7.1 Key trends
- 7.2 Petrochemical feedstock
- 7.3 Polymer production
- 7.4 Chemical manufacturing
- 7.5 Fuel production
- 7.6 Specialty applications
Chapter 8 Market Estimates and Forecast, By End Use, 2021-2034 (USD Million & Tons)
- 8.1 Key trends
- 8.2 Packaging
- 8.3 Petrochemicals & chemicals
- 8.4 Automotive
- 8.5 Construction & building
- 8.6 Textiles & fashion
- 8.7 Electronics
Chapter 9 Market Estimates and Forecast, By Region, 2021-2034 (USD Million & Tons)
- 9.1 Key trends
- 9.2 North America
- 9.2.1 U.S.
- 9.2.2 Canada
- 9.3 Europe
- 9.3.1 Germany
- 9.3.2 UK
- 9.3.3 France
- 9.3.4 Spain
- 9.3.5 Italy
- 9.3.6 Rest of Europe
- 9.4 Asia Pacific
- 9.4.1 China
- 9.4.2 India
- 9.4.3 Japan
- 9.4.4 Australia
- 9.4.5 South Korea
- 9.4.6 Rest of Asia Pacific
- 9.5 Latin America
- 9.5.1 Brazil
- 9.5.2 Mexico
- 9.5.3 Argentina
- 9.5.4 Rest of Latin America
- 9.6 Middle East and Africa
- 9.6.1 Saudi Arabia
- 9.6.2 South Africa
- 9.6.3 UAE
- 9.6.4 Rest of Middle East and Africa
Chapter 10 Company Profiles
- 10.1 Agilyx Corporation
- 10.2 BASF SE
- 10.3 BlueAlp Holding BV
- 10.4 Brightmark LLC
- 10.5 Dow Inc.
- 10.6 Evonik Industries AG
- 10.7 Exxon Mobil Corporation
- 10.8 INEOS Group
- 10.9 Mitsubishi Chemical Group Corporation
- 10.10 Mura Technology Limited
- 10.11 Nexus Circular LLC
- 10.12 Plastic Energy Limited
- 10.13 PureCycle Technologies, Inc.
- 10.14 Quantafuel ASA
- 10.15 Saudi Basic Industries Corporation (SABIC)
- 10.16 Shell plc
- 10.17 Versalis S.p.A. (Eni)

