
PUBLISHER: Global Market Insights Inc. | PRODUCT CODE: 1885803

PUBLISHER: Global Market Insights Inc. | PRODUCT CODE: 1885803
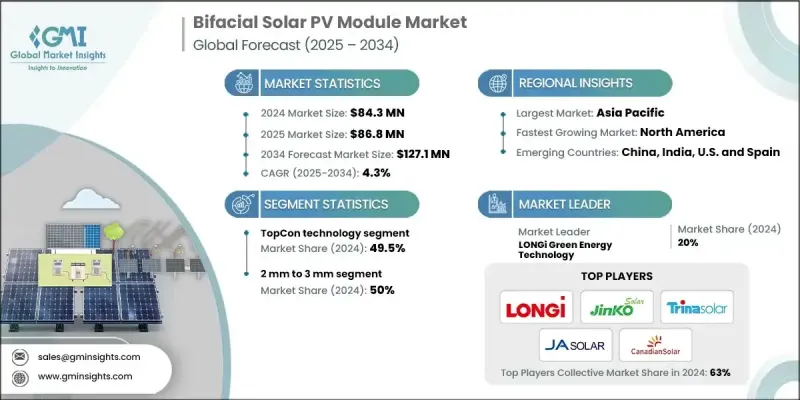
Bifacial Solar PV Module Market Opportunity, Growth Drivers, Industry Trend Analysis, and Forecast 2025 - 2034
The Global Bifacial Solar PV Module Market reached USD 84.3 million in 2024 and is estimated to grow at a CAGR of 4.3% to reach USD 127.1 million by 2034.
Global momentum toward utility-scale solar installations remains the primary catalyst for increasing adoption of bifacial systems. Large-scale developers benefit significantly from these modules because they allow optimized site design and seamless integration with advanced tracking systems, ultimately boosting rear-side irradiation capture and overall energy output. Bifacial technology combined with single-axis tracking has emerged as the preferred configuration for new ground-mounted setups, with over half of new installations integrating SAT systems. Multiple techno-economic evaluations have consistently shown that pairing bifacial modules with trackers delivers some of the lowest LCOE outcomes, driven by energy gains of 15-20% from tracking and an additional uplift attributed to bifacial performance. As the industry accelerates the shift from PERC to n-type architectures, technologies such as TOPCon continue to gain traction due to their improved temperature coefficients, higher bifaciality, and stronger performance under elevated temperatures and high-irradiance conditions. In regions characterized by intense sunlight and reflective terrain, bifacial modules deliver yield advantages that justify notable cost premiums over earlier-generation modules, strengthening demand across diverse markets.
| Market Scope | |
|---|---|
| Start Year | 2024 |
| Forecast Year | 2025-2034 |
| Start Value | $84.3 Million |
| Forecast Value | $127.1 Million |
| CAGR | 4.3% |
The HJT segment is projected to grow at a CAGR of 8.5% through 2034, supported by its notably high bifaciality levels, favorable temperature profiles, and strong low-light efficiency. Although adoption has been restrained by higher production expenses and concerns regarding encapsulant durability, ongoing innovation focused on cost reduction and material enhancements is shaping future growth.
The 2 mm segment is forecast to grow at a 5% CAGR by 2034, driven by its suitability for lightweight and specialized applications such as portable energy solutions and building-integrated photovoltaic designs. Its thinner structure decreases module weight while maintaining structural performance, enabling reduced transportation and BOS-related expenses and supporting broader uptake among rooftop and tracker-enabled installations.
U.S. Bifacial Solar PV Module Market reached USD 15 million in 2024. Utility-scale deployments in the country utilize tracking systems extensively, generating sustained demand for bifacial modules. Forecasts indicate a steady rise in bifaciality factors over the coming decade, which will contribute to improved capacity factors and lower system-level costs.
Key companies participating in the Global Bifacial Solar PV Module Market include JA Solar Technology, Reliance New Energy, Boviet Solar Group, Solaria Corporation, JinkoSolar Holding Co., Ltd., REC Group, Meyer Burger, Sunergy, Trina Solar, LONGi Green Energy Technology, First Solar, 3Sun, Sharp Corporation, Hanwha Q CELLS Co., Ltd., Astroenergy, SunPower Corporation, Risen Energy, Seraphim Solar, Canadian Solar, and Vikram Solar.
Companies in the Global Bifacial Solar PV Module Market strengthen their competitive position through targeted strategies that focus on technological innovation, manufacturing efficiency, and global expansion. Many firms are increasing investments in n-type cell architectures, advanced encapsulation materials, and higher efficiency module formats to improve output and reduce degradation rates. Scaling production capacity, optimizing supply chains, and automating manufacturing processes help reduce overall costs while supporting wider market reach. Collaboration with tracker manufacturers, EPC firms, and utility developers enables integrated system-level performance gains. Companies also pursue strategic partnerships, regional manufacturing facilities, and diversification of product portfolios to address demand across residential, commercial, and utility-scale segments.
Table of Contents
Chapter 1 Methodology & Scope
- 1.1 Research design
- 1.1.1 Research approach
- 1.1.2 Data collection methods
- 1.1.3 Base estimates and calculations
- 1.1.4 Base year calculation
- 1.1.5 Key trends for market estimates
- 1.2 Forecast model
- 1.3 Primary research & validation
- 1.3.1 Primary sources
- 1.4 Data mining sources
- 1.5 Market definitions
Chapter 2 Executive Summary
- 2.1 Industry 3600 synopsis, 2021 - 2034
- 2.2 Business trends
- 2.3 Type trends
- 2.4 Technology trends
- 2.5 Application trends
- 2.6 Frame type trends
- 2.7 Thickness trends
- 2.8 Regional trends
Chapter 3 Industry Insights
- 3.1 Industry ecosystem
- 3.2 Regulatory landscape
- 3.3 Industry impact forces
- 3.3.1 Growth drivers
- 3.3.2 Industry pitfalls & challenges
- 3.4 Growth potential analysis
- 3.5 Porter's analysis
- 3.5.1 Bargaining power of suppliers
- 3.5.2 Bargaining power of buyers
- 3.5.3 Threat of new entrants
- 3.5.4 Threat of substitutes
- 3.6 PESTEL analysis
Chapter 4 Competitive landscape, 2025
- 4.1 Introduction
- 4.2 Company market share analysis, by region, 2024
- 4.2.1 North America
- 4.2.2 Europe
- 4.2.3 Asia Pacific
- 4.2.4 Middle East & Africa
- 4.2.5 Latin America
- 4.3 Strategic dashboard
- 4.4 Strategic initiatives
- 4.5 Company benchmarking
- 4.6 Innovation & technology landscape
Chapter 5 Market Size and Forecast, By Type, 2021 - 2034 (USD Million & MW)
- 5.1 Key trends
- 5.2 Dual glass
- 5.3 Glass backsheet
Chapter 6 Market Size and Forecast, By Technology, 2021 - 2034 (USD Million & MW)
- 6.1 Key trends
- 6.2 PERC
- 6.3 TopCon
- 6.4 HJT
- 6.5 Others
Chapter 7 Market Size and Forecast, By Application, 2021 - 2034 (USD Million, Million m2 & MW)
- 7.1 Key trends
- 7.2 Residential
- 7.3 Commercial & Industrial
- 7.4 Utility
Chapter 8 Market Size and Forecast, By Frame type, 2021 - 2034 (USD Million & MW)
- 8.1 Key trends
- 8.2 Framed
- 8.3 Frameless
Chapter 9 Market Size and Forecast, By Thickness, 2021 - 2034 (USD Million & MW)
- 9.1 Key trends
- 9.2 < 2 mm
- 9.3 2 mm to 3 mm
- 9.4 > 3 mm
Chapter 10 Market Size and Forecast, By Region, 2021 - 2034 (USD Million & MW)
- 10.1 Key trends
- 10.2 North America
- 10.2.1 U.S.
- 10.2.2 Canada
- 10.2.3 Mexico
- 10.3 Europe
- 10.3.1 Germany
- 10.3.2 UK
- 10.3.3 France
- 10.3.4 Netherlands
- 10.3.5 Spain
- 10.4 Asia Pacific
- 10.4.1 China
- 10.4.2 India
- 10.4.3 Japan
- 10.4.4 South Korea
- 10.4.5 Australia
- 10.5 Middle East & Africa
- 10.5.1 UAE
- 10.5.2 Saudi Arabia
- 10.5.3 South Africa
- 10.5.4 Qatar
- 10.5.5 Egypt
- 10.6 Latin America
- 10.6.1 Brazil
- 10.6.2 Chile
- 10.6.3 Argentina
Chapter 11 Company Profiles
- 11.1 3Sun
- 11.2 Astroenergy
- 11.3 Boviet Solar Group
- 11.4 Canadian Solar
- 11.5 First Solar
- 11.6 Hanwha Q CELLS Co., Ltd.
- 11.7 JA Solar Technology
- 11.8 JinkoSolar Holding Co., Ltd.
- 11.9 LONGi Green Energy Technology
- 11.10 Meyer Burger
- 11.11 REC Group
- 11.12 Reliance New Energy
- 11.13 Risen Energy
- 11.14 Sharp Corporation
- 11.15 Seraphim Solar
- 11.16 Solaria Corporation
- 11.17 Sunergy
- 11.18 SunPower Corporation
- 11.19 Trina Solar
- 11.20 Vikram Solar

