
PUBLISHER: Global Market Insights Inc. | PRODUCT CODE: 1885900

PUBLISHER: Global Market Insights Inc. | PRODUCT CODE: 1885900
Africa Connected TV Market Opportunity, Growth Drivers, Industry Trend Analysis, and Forecast 2025 - 2034
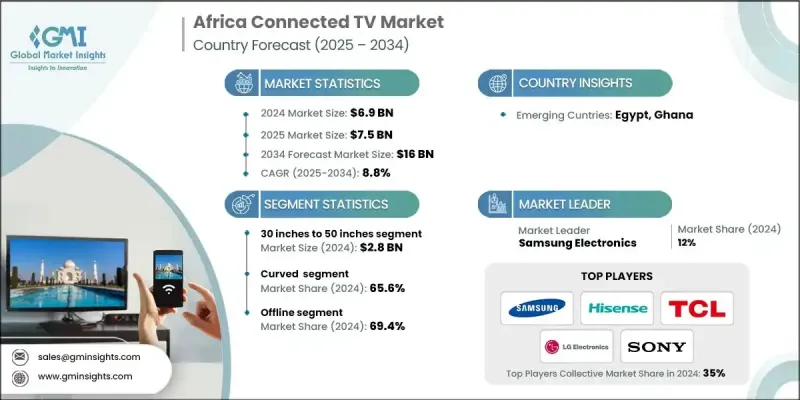
Africa Connected TV Market was valued at USD 6.9 billion in 2024 and is estimated to grow at a CAGR of 8.8% to reach USD 16 billion by 2034.
Rapid internet penetration and expanding mobile connectivity are driving this growth across the continent. Countries are witnessing significant improvements in broadband access and mobile network coverage, enabling uninterrupted streaming on smart TVs and OTT platforms. Declining data costs and the rollout of 4G and 5G networks are making high-quality video accessible to both urban and semi-urban populations, accelerating adoption. The proliferation of mobile internet is also encouraging multi-device viewing, where consumers use smartphones to discover, control, and interact with content on smart TVs. Telecom operators are supporting growth by offering bundled data and streaming plans, reducing barriers for consumers. Rising connectivity creates opportunities for marketers and content creators to engage new audiences through targeted and localized streaming services, strengthening the overall connected TV ecosystem across Africa.
| Market Scope | |
|---|---|
| Start Year | 2024 |
| Forecast Year | 2025-2034 |
| Start Value | $6.9 Billion |
| Forecast Value | $16 Billion |
| CAGR | 8.8% |
In 2024, the 30-inch to 50-inch screen size segment generated USD 2.8 billion. These screen sizes strike a balance between affordability and functionality, appealing to middle-income households and urban consumers seeking smart features without the premium of larger displays. Compact screens also suit smaller living spaces common in rapidly urbanizing regions, enhancing viewing comfort and immersion.
The curved TVs segment accounted for a 65.6% share in 2024. The curved design creates a more immersive experience with better depth perception and reduced edge distortion. While less common than flat screens due to higher costs, curved TVs are gaining traction among tech-savvy urban households seeking value-added home entertainment experiences.
South Africa Connected TV Market held a 27% share and generated USD 1.7 billion in 2024. Growing awareness of digital lifestyles and entertainment consumption has fueled demand for connected TVs. Consumers increasingly seek high-quality, immersive viewing experiences, driving sales across both residential and commercial segments.
Key players in the Africa Connected TV Market include Samsung Electronics, LG Electronics, Panasonic, Philips, Sony, TCL Technology, Apple, Xiaomi, Google, Hisense Group, Sharp, Amazon, Vestel, and Haier Group. Companies in the Africa Connected TV Market are implementing several strategies to expand their presence. They are investing in affordable smart TV models to target middle-income households while offering premium devices for affluent consumers. Partnerships with telecom operators and streaming platforms allow bundled services that increase adoption. Firms are enhancing regional distribution networks to improve accessibility in urban and semi-urban areas. Marketing campaigns focus on localized content, targeted promotions, and brand visibility. Additionally, companies are investing in R&D to introduce energy-efficient, high-resolution, and curved-screen innovations, catering to evolving consumer preferences and strengthening their market foothold.
Table of Contents
Chapter 1 Methodology and Scope
- 1.1 Market scope and definition
- 1.2 Research design
- 1.2.1 Research approach
- 1.2.2 Data collection methods
- 1.3 Data mining sources
- 1.3.1 Regional
- 1.4 Base estimates and calculations
- 1.4.1 Base year calculation
- 1.4.2 Key trends for market estimation
- 1.5 Primary research and validation
- 1.5.1 Primary sources
- 1.6 Forecast model
- 1.7 Research assumptions and limitations
Chapter 2 Executive Summary
- 2.1 Industry 360° synopsis
- 2.2 Key market trends
- 2.2.1 Region trends
- 2.2.2 Screen size
- 2.2.3 Technology
- 2.2.4 Screen type
- 2.2.5 Resolution
- 2.2.6 End Use
- 2.2.7 Distribution channel
- 2.3 CXO perspectives: Strategic imperatives
- 2.3.1 Key decision points for industry executives
- 2.3.2 Critical success factors for market players
- 2.4 Future outlook and strategic recommendations
Chapter 3 Industry Insights
- 3.1 Industry ecosystem analysis
- 3.1.1 Supplier landscape
- 3.1.2 Profit margin
- 3.1.3 Value addition at each stage
- 3.1.4 Factor affecting the value chain
- 3.2 Industry impact forces
- 3.2.1 Growth drivers
- 3.2.1.1 Rapid internet and mobile connectivity expansion
- 3.2.1.2 Surging urbanization and rising middle-class incomes
- 3.2.1.3 Technological enhancements and smart features
- 3.2.2 Industry pitfalls & challenges
- 3.2.2.1 Limited broadband availability in some regions
- 3.2.2.2 High data costs and inconsistent power infrastructure
- 3.2.3 Opportunities
- 3.2.3.1 Ad-funded streaming and FAST models
- 3.2.3.2 Digital advertising shift
- 3.2.1 Growth drivers
- 3.3 Growth potential analysis
- 3.4 Future market trends
- 3.5 Technology and innovation landscape
- 3.5.1 Current technological trends
- 3.5.2 Emerging technologies
- 3.6 Price trends
- 3.6.1 By countries
- 3.6.2 By screen size
- 3.7 Regulatory landscape
- 3.7.1 Standards and compliance requirements
- 3.7.2 Regional regulatory frameworks
- 3.7.3 Certification standards
- 3.8 Porter's analysis
- 3.9 PESTEL analysis
- 3.10 Consumer behavior analysis
- 3.10.1 Purchasing patterns
- 3.10.2 Preference analysis
- 3.10.3 Regional variations in consumer behavior
- 3.10.4 Impact of e-commerce on buying decisions
Chapter 4 Competitive Landscape, 2024
- 4.1 Introduction
- 4.2 Company market share analysis
- 4.3 Company matrix analysis
- 4.4 Competitive analysis of major market players
- 4.5 Competitive positioning matrix
- 4.6 Key developments
- 4.6.1 Mergers & acquisitions
- 4.6.2 Partnerships & collaborations
- 4.6.3 New product launches
- 4.6.4 Expansion plans
Chapter 5 Market Estimates and Forecast, By Screen Size, 2021 - 2034 (USD Billion) (Billion Units)
- 5.1 Key trends
- 5.2 Less than 30 inches
- 5.3 30 inches to 50 inches
- 5.4 50 inches to 70 inches
- 5.5 Above 70 inches
Chapter 6 Market Estimates and Forecast, By Technology, 2021 - 2034 (USD Billion) (Billion Units)
- 6.1 Key trends
- 6.2 LED
- 6.3 OLED
Chapter 7 Market Estimates and Forecast, By Screen Type, 2021 - 2034 (USD Billion) (Billion Units)
- 7.1 Key trends
- 7.2 Curved
- 7.3 Flat
Chapter 8 Market Estimates and Forecast, By Resolution, 2021 - 2034 (USD Billion) (Billion Units)
- 8.1 Key trends
- 8.2 8K
- 8.3 4K
- 8.4 1080p
- 8.5 Others
Chapter 9 Market Estimates and Forecast, By End Use, 2021 - 2034 (USD Billion) (Billion Units)
- 9.1 Key trends
- 9.2 Residential
- 9.3 Commercial
Chapter 10 Market Estimates and Forecast, By Distribution Channel, 2021 - 2034 (USD Billion) (Billion Units)
- 10.1 Key trends
- 10.2 Offline
- 10.2.1 Specialty stores
- 10.2.2 Supermarkets & hypermarkets
- 10.2.3 Others
- 10.3 Online
- 10.3.1 E-commerce
- 10.3.2 Brand websites
Chapter 11 Market Estimates and Forecast, By Countries, 2021 - 2034 (USD Billion) (Billion Units)
- 11.1 Key trends
- 11.2 South Africa
- 11.3 Nigeria
- 11.4 Kenya
- 11.5 Egypt
- 11.6 Ghana
- 11.7 Rest of Africa
Chapter 12 Company Profiles
- 12.1 Amazon
- 12.2 Apple
- 12.3 Google
- 12.4 Hisense Group
- 12.5 LG Electronics
- 12.6 Panasonic
- 12.7 Philips
- 12.8 Samsung Electronics
- 12.9 Sharp
- 12.10 Skyworth Group
- 12.11 Sony
- 12.12 TCL Technology
- 12.13 Xiaomi
- 12.14 Haier Group
- 12.15 Vestel

