
PUBLISHER: Global Market Insights Inc. | PRODUCT CODE: 1928870

PUBLISHER: Global Market Insights Inc. | PRODUCT CODE: 1928870
Asia Pacific SSC and Fishing Gaming Market Opportunity, Growth Drivers, Industry Trend Analysis, and Forecast 2026 - 2035
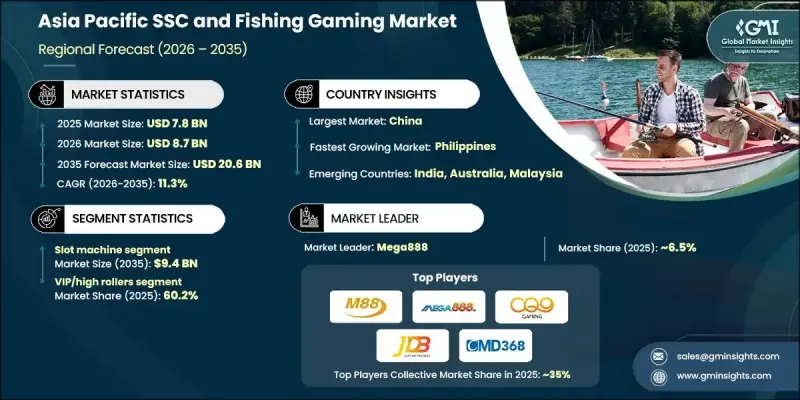
Asia Pacific SSC and Fishing Gaming Market was valued at USD 7.8 billion in 2025 and is estimated to grow at a CAGR of 11.3% to reach USD 20.6 billion by 2035.
Growth is shaped by rising demand for immersive and socially connected gaming environments built on mobile-first design and cloud-based platforms. As smartphone usage and next-generation network coverage increase across the region, players are seeking uninterrupted multiplayer gameplay and interactive social elements. Gaming is increasingly positioned as a shared digital activity rather than an individual experience, supporting longer session times and improved user retention. Cloud-based delivery models are further expanding accessibility by allowing high-quality gaming experiences on devices with limited processing power. This is particularly impactful across developing Asia Pacific economies where device capabilities vary, but internet infrastructure continues to advance. Cross-platform compatibility enables users to move between devices without losing progress, helping developers expand reach and sustain engagement across diverse user bases.
| Market Scope | |
|---|---|
| Start Year | 2025 |
| Forecast Year | 2026-2035 |
| Start Value | $7.8 Billion |
| Forecast Value | $20.6 Billion |
| CAGR | 11.3% |
The VIP and high-roller segment held a 60.2% share in 2025. This segment leads because a relatively small group of players generates industry revenue through substantial spending on premium content, digital currency, and exclusive in-game experiences. While casual participants support user volume, revenue concentration remains heavily weighted toward high-value players, making this segment essential to overall market performance.
China SSC and Fishing Gaming Market accounted for USD 1.9 billion in 2025 and is expected to grow at a CAGR of 10.1% from 2026 to 2035. The country's rapid market expansion is supported by large-scale digital adoption and a strong user base actively engaging with online entertainment platforms. High engagement intensity among frequent users continues to reinforce revenue growth across social casino and fishing gaming formats.
Key companies active in the Asia Pacific SSC and Fishing Gaming Market include Mega888, CQ9 Fish Gaming Malaysia, CMD368, Ocean King Malaysia, JDB Gaming Fish, iBET Malaysia, Fishing War Singapore, Dragon Tiger Fish Gaming, M88 Singapore, playing.io, Newtown Casino, k8.com, sports.mtt.xyz, and Playing.io. Companies operating in the Asia Pacific SSC and Fishing Gaming Market are strengthening their market positions through technology-driven innovation and user-centric engagement strategies. Developers are investing in cloud gaming infrastructure to improve accessibility and reduce hardware dependence. Social interaction features, loyalty programs, and personalized in-game rewards are being expanded to retain high-value users. Many firms are focusing on data analytics to understand player behavior and optimize monetization models. Strategic localization of content helps align games with regional preferences.
Table of Contents
Chapter 1 Methodology & Scope
- 1.1 Market scope and definition
- 1.2 Research design
- 1.2.1 Research approach
- 1.2.2 Data collection methods
- 1.3 Data mining sources
- 1.3.1 Global
- 1.3.2 Regional/Country
- 1.4 Base estimates and calculations
- 1.4.1 Base year calculation
- 1.4.2 Key trends for market estimation
- 1.5 Primary research and validation
- 1.5.1 Primary sources
- 1.5.1.1 Licensed Operators
- 1.5.1.2 Grey Market Intelligence
- 1.5.1 Primary sources
- 1.6 Forecast model
- 1.7 Research assumptions and limitations
Chapter 2 Executive Summary
- 2.1 Industry 360° synopsis
- 2.2 Key market trends
- 2.2.1 Game category trends
- 2.2.2 Revenue stream trends
- 2.2.3 Participant tier trends
- 2.3 CXO perspective: Strategic imperatives
- 2.3.1 Key decision points for industry executives
- 2.3.2 Critical success factors for market players
- 2.4 Market Entry Readiness Assessment
- 2.5 Future outlook and strategic recommendations
- 2.6 Strategic recommendations
- 2.6.1 Supply chain diversification strategy
- 2.6.2 Product portfolio enhancement
- 2.6.3 Partnership and alliance opportunities
- 2.6.4 Cost management and pricing strategy
- 2.7 Decision framework
- 2.7.1 Investment priority matrix
- 2.7.2 Risk-adjusted ROI analysis
Chapter 3 Industry Insights
- 3.1 Industry ecosystem analysis
- 3.1.1 Gaming value chain revenue distribution analysis
- 3.1.2 B2B platform services market sizing & growth projections
- 3.1.3 Technology provider revenue models & profit margins
- 3.1.4 Platform-as-a-Service market evolution & trends
- 3.2 Industry impact forces
- 3.2.1 Growth drivers
- 3.2.2 Industry pitfalls & challenges
- 3.2.3 Opportunities
- 3.3 Growth potential analysis
- 3.4 Future market trends
- 3.5 Regulatory framework
- 3.5.1 Gaming Regulatory Landscape
- 3.5.2 Enforcement Patterns & Grey Market Operations
- 3.5.3 Compliance Costs & Requirements for Platform Providers
- 3.6 Major market trends and disruptions
- 3.7 Technological and innovation landscape
- 3.7.1 Current technological trends
- 3.7.2 Emerging technologies
- 3.8 Pricing analysis, 2024
- 3.8.1 Platform type and region
- 3.8.2 Application/Subscription cost
- 3.8.3 Real vs. perceived capacity constraints in supply of platform integration
- 3.8.4 Operator price increase validation
- 3.9 Operational Metrics Analysis
- 3.9.1 ARPU (Average Revenue Per User), by Game Type
- 3.9.1.1 By Region
- 3.9.2 CAC (Customer Acquisition Cost), by Channel
- 3.9.2.1 By Region
- 3.9.3 Retention Rates, by Game Type
- 3.9.3.1 By Region
- 3.9.1 ARPU (Average Revenue Per User), by Game Type
- 3.10 User behavior analysis
- 3.10.1 Purchasing patterns
- 3.10.2 Preference analysis
- 3.10.3 Regional variations in user behavior
- 3.11 Porter's five forces analysis
- 3.12 PESTEL analysis
Chapter 4 Competitive Landscape, 2025
- 4.1 Introduction
- 4.2 Company market share analysis
- 4.2.1 By Country
- 4.3 Company matrix analysis
- 4.4 Competitive analysis of major market players
- 4.5 Competitive positioning matrix
- 4.6 Product portfolio benchmarking
- 4.7 Key developments
- 4.7.1 Mergers & acquisitions
- 4.7.2 Partnerships & collaborations
- 4.7.3 New Product Launches
- 4.7.4 Expansion Plans
Chapter 5 Market Estimates & Forecast, By Game Category 2022 - 2035 (USD Billion)
- 5.1 Key trends
- 5.2 Slot Machine
- 5.2.1 Double collect games
- 5.2.2 3-Reel Classic Performance
- 5.2.3 Mega Way Games
- 5.2.4 Cascading/Tumbling Reel Games
- 5.2.5 Three Collect Games
- 5.2.6 Others
- 5.3 Fishing Games
- 5.4 Live Dealer Games
- 5.4.1 Mobile gaming platforms
- 5.4.2 PC gaming platforms
Chapter 6 Market Estimates & Forecast, By Revenue Stream, 2022 - 2035 (USD Billion)
- 6.1 Key trends
- 6.2 Licensed Online Gaming Platforms
- 6.2.1 Local sites
- 6.2.2 Foreign sites
- 6.3 SSC (Sweepstake + Online Casino + Cash Gambling) Platforms
- 6.3.1 Sweepstake Casino Operations
- 6.3.2 Direct Online Casino Sites
- 6.3.3 Cash Gambling Platforms
- 6.4 Offline Casino Operations
- 6.4.1 Traditional slot machines
- 6.4.2 Table game
Chapter 7 Market Estimates & Forecast, By Participant Tier, 2022 - 2035 (USD Billion)
- 7.1 Key trends
- 7.2 VIP/High Rollers
- 7.3 Regular Players
- 7.4 Casual Players
- 7.5 Micro Players
Chapter 8 Market Estimates & Forecast, By Country, 2022 - 2035, (USD Billion)
- 8.1 Key trends
- 8.2 China
- 8.3 India
- 8.4 Japan
- 8.5 South Korea
- 8.6 Australia
- 8.7 Singapore
- 8.8 Malaysia
- 8.9 Vietnam
- 8.10 Indonesia
- 8.11 Philippines
- 8.12 Rest of Asia Pacific
Chapter 9 Company Profiles (Business Overview, Financial Data, Product Landscape, Strategic Outlook, SWOT Analysis)
- 9.1 CMD368
- 9.2 CQ9 Fish Gaming Malaysia
- 9.3 Dragon Tiger Fish Gaming
- 9.4 Fishing War Singapore
- 9.5 iBET Malaysia
- 9.6 JDB Gaming Fish
- 9.7 k8.com
- 9.8 M88 Singapore
- 9.9 Mega888
- 9.10 Newtown Casino
- 9.11 Ocean King Malaysia
- 9.12 playing.io
- 9.13 sports.mtt.xyz

