
PUBLISHER: Mordor Intelligence | PRODUCT CODE: 1910903

PUBLISHER: Mordor Intelligence | PRODUCT CODE: 1910903
North America Gaming - Market Share Analysis, Industry Trends & Statistics, Growth Forecasts (2026 - 2031)
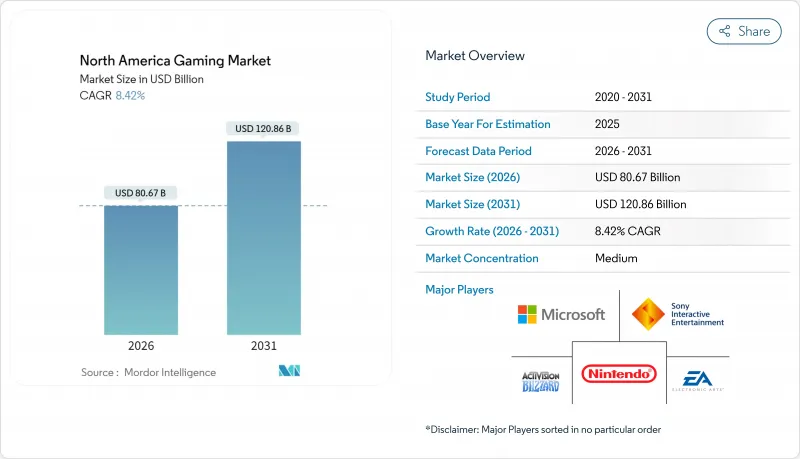
The North America gaming market size in 2026 is estimated at USD 80.67 billion, growing from 2025 value of USD 74.40 billion with 2031 projections showing USD 120.86 billion, growing at 8.42% CAGR over 2026-2031.
Dynamic price-tiered subscriptions, AI-guided in-app purchases, and cloud delivery of AAA titles converge to lift average revenue per user across platforms. Cloud infrastructure removes hardware barriers, allowing console-quality experiences on smartphones and low-spec PCs, while cross-platform engines compress development cycles and broaden addressable audiences. The interplay of free-to-play microtransactions with premium subscription overlays buffers the sector against macro headwinds, sustaining double-digit growth in player spending. Competitive intensity rises as legacy console makers, mobile-first publishers, and cloud gatekeepers jostle for ecosystem control, each harnessing AI to cut acquisition costs and stretch player lifetime value.
North America Gaming Market Trends and Insights
Surge in Mobile-First Casual Gaming Spend
Personalised in-app purchase algorithms now deliver conversion rates over three times higher than banner ads, repositioning casual mobile titles as the growth engine of the North America gaming market. Unity's Vector AI draws on billions of daily data points to predict purchasing propensity and set real-time bid prices, letting developers monetise without expanding ad-spend footprints. Subscription options that strip ads and unlock cosmetics are gaining traction with casual audiences who value frictionless play. Social-layer integration with messaging and influencer platforms supplies viral reach that offsets rising paid-acquisition costs.
Subscription Services Gaining ARPU via Price-Tier Stacking
Subscription catalogues have shifted from flat pricing to multi-tier ladders aligned with user engagement and device access. Xbox Game Pass exemplifies the trend, offering console-only, PC-only, and cross-platform bundles that target discrete willingness-to-pay thresholds. Publishers ingest gameplay telemetry to test elastic pricing, minimising churn by presenting upgrade prompts at peak engagement moments. Cloud streaming nested inside premium tiers removes hardware gating and entices lapsed console owners back into the spending funnel.
Hardware Refresh Slump Post-COVID and Macro Headwinds
Console and GPU demand cooled after the pandemic binge, with Microsoft citing a 13% decline in Xbox hardware revenue as households delay upgrades. Flat upgrade cycles ripple into lower attach rates for premium software and peripherals, trimming near-term growth. While cloud gaming mitigates hardware reliance, latency concerns keep hardcore users tethered to local performance, limiting substitution.
Other drivers and restraints analyzed in the detailed report include:
- Esports Sponsorship Inflows and Media-Rights Escalation
- AI-Driven User-Acquisition and Retention Modelling Boosts LTV
- Rising Acquisition Costs and Ad-Signal Loss on Mobile
For complete list of drivers and restraints, kindly check the Table Of Contents.
Segment Analysis
Mobile titles delivered 48.75% of 2025 revenues, making the segment the anchor of the North America gaming market. Cloud gaming follows with a 9.72% CAGR forecast through 2031, enabled by hyperscale edge nodes that stream 60 fps gameplay to browsers and low-end devices. The North America gaming market size attributable to mobile is expected to cross USD 60.35 billion by 2031, whereas cloud's share will more than double over the period. As 5G coverage densifies, users toggle between local and streamed play, with cross-save functionality preserving progression across devices. Console makers now deploy cloud extensions to widen funnel reach, while PC storefronts integrate remote-play modules to protect library relevance.
Hybrid play patterns are reshaping content roadmaps. Developers build scalable asset pipelines that down-rez textures for mobile GPUs yet stream full fidelity on fiber connections. Cross-platform engines shorten porting cycles, letting studios synchronise updates and monetisation events across endpoints. This cohesion further cements the North America gaming market as an ecosystem rather than siloed device verticals.
Free-to-play mechanics captured 58.15% of 2025 spend, anchored by cosmetic microtransactions and season passes. Subscription layers add predictable cash-flow, growing at 9.48% CAGR on the promise of frictionless access and cloud portability. Shooter and RPG franchises now bundle season content drops inside low-priced subscriptions to curb churn. The hybrid "freemium-plus-subscription" scheme lifts monetisation ceiling without alienating price-sensitive segments.
Among high-spenders, premium box sales still thrive when matched with cinematic single-player narratives. Limited collector editions and pre-order perks sync revenue before release, while live-service DLC extends tail revenue. Advertising revenue recovers as contextual targeting algorithms offset signal loss, though dependence on ad fill rates leaves smaller studios exposed to macro advertising cycles.
The North America Gaming Market Report is Segmented by Platform (Console Gaming, PC Gaming, Mobile Gaming, and Cloud Gaming and Streaming), Revenue Model (Premium, Free-To-Play, and More), Genre (Shooter, Sports, Role-Playing/Adventure, and More), Gamer Type (Casual Gamers, Competitive/Esports Gamers, Hardcore/Core Gamers, and Social Gamers), and Country. The Market Forecasts are Provided in Terms of Value (USD).
List of Companies Covered in this Report:
- Activision Blizzard, Inc.
- Electronic Arts Inc.
- Microsoft Corporation
- Sony Interactive Entertainment LLC
- Nintendo Co., Ltd.
- Take-Two Interactive Software, Inc.
- Ubisoft Entertainment SA
- Valve Corporation
- Epic Games, Inc.
- Riot Games, Inc.
- Roblox Corporation
- Square Enix Holdings Co., Ltd.
- Bandai Namco Holdings Inc.
- NetEase, Inc.
- Tencent Holdings Ltd. (North-America studios)
- CD PROJEKT S.A.
- SEGA Corporation
- Warner Bros. Games Inc.
- Bethesda Softworks LLC
- Zynga Inc.
- Capcom Co., Ltd.
Additional Benefits:
- The market estimate (ME) sheet in Excel format
- 3 months of analyst support
TABLE OF CONTENTS
1 INTRODUCTION
- 1.1 Study Assumptions and Market Definition
- 1.2 Scope of the Study
2 RESEARCH METHODOLOGY
3 EXECUTIVE SUMMARY
4 MARKET LANDSCAPE
- 4.1 Market Overview
- 4.2 Market Drivers
- 4.2.1 Surge in mobile-first casual gaming spend
- 4.2.2 Subscription services gaining ARPU via price-tier stacking
- 4.2.3 Cross-platform engine and live-ops tool adoption lowering development cycles
- 4.2.4 Esports sponsorship inflows and media-rights escalation
- 4.2.5 Cloud/edge infrastructure cuts hardware barriers for AAA experiences
- 4.2.6 AI-driven user-acquisition and retention modelling boosts LTV
- 4.3 Market Restraints
- 4.3.1 Hardware refresh slump post-COVID and macro headwinds
- 4.3.2 Rising acquisition costs and ad-signal loss on mobile
- 4.3.3 Regulatory scrutiny on loot-boxes and data privacy
- 4.3.4 Talent layoffs eroding institutional knowledge and delaying releases
- 4.4 Industry Value Chain Analysis
- 4.5 Regulatory Landscape
- 4.6 Technological Outlook
- 4.7 Porter's Five Forces Analysis
- 4.7.1 Threat of New Entrants
- 4.7.2 Bargaining Power of Suppliers
- 4.7.3 Bargaining Power of Consumers
- 4.7.4 Intensity of Competitive Rivalry
- 4.7.5 Threat of Substitutes
- 4.8 Impact of Macroeconomic Trends on the Market
5 MARKET SIZE AND GROWTH FORECASTS (VALUES)
- 5.1 By Platform
- 5.1.1 Console Gaming
- 5.1.2 PC Gaming
- 5.1.3 Mobile Gaming
- 5.1.4 Cloud Gaming and Streaming
- 5.2 By Revenue Model
- 5.2.1 Premium (Full-Priced)
- 5.2.2 Free-to-Play/Micro-transactions
- 5.2.3 Subscription Services
- 5.2.4 Advertising and In-Game Purchases
- 5.3 By Genre
- 5.3.1 Shooter
- 5.3.2 Sports
- 5.3.3 Role-Playing/Adventure
- 5.3.4 Strategy
- 5.3.5 Puzzle and Casual
- 5.3.6 Casino and Social Casino
- 5.4 By Gamer Type
- 5.4.1 Casual Gamers
- 5.4.2 Competitive/Esports Gamers
- 5.4.3 Hardcore/Core Gamers
- 5.4.4 Social Gamers
- 5.5 By Country
- 5.5.1 United States
- 5.5.2 Canada
- 5.5.3 Mexico
6 COMPETITIVE LANDSCAPE
- 6.1 Market Concentration
- 6.2 Strategic Moves
- 6.3 Market Share Analysis
- 6.4 Company Profiles (includes Global level overview, Market level overview, Core segments, Financials, Strategic information, Market rank/share, Products and Services, Recent developments)
- 6.4.1 Activision Blizzard, Inc.
- 6.4.2 Electronic Arts Inc.
- 6.4.3 Microsoft Corporation
- 6.4.4 Sony Interactive Entertainment LLC
- 6.4.5 Nintendo Co., Ltd.
- 6.4.6 Take-Two Interactive Software, Inc.
- 6.4.7 Ubisoft Entertainment SA
- 6.4.8 Valve Corporation
- 6.4.9 Epic Games, Inc.
- 6.4.10 Riot Games, Inc.
- 6.4.11 Roblox Corporation
- 6.4.12 Square Enix Holdings Co., Ltd.
- 6.4.13 Bandai Namco Holdings Inc.
- 6.4.14 NetEase, Inc.
- 6.4.15 Tencent Holdings Ltd. (North-America studios)
- 6.4.16 CD PROJEKT S.A.
- 6.4.17 SEGA Corporation
- 6.4.18 Warner Bros. Games Inc.
- 6.4.19 Bethesda Softworks LLC
- 6.4.20 Zynga Inc.
- 6.4.21 Capcom Co., Ltd.
7 MARKET OPPORTUNITIES AND FUTURE OUTLOOK
- 7.1 White-space and Unmet-Need Assessment

