
PUBLISHER: Global Market Insights Inc. | PRODUCT CODE: 1936617

PUBLISHER: Global Market Insights Inc. | PRODUCT CODE: 1936617
Sustainable Manufacturing Equipment Market Opportunity, Growth Drivers, Industry Trend Analysis, and Forecast 2026 - 2035
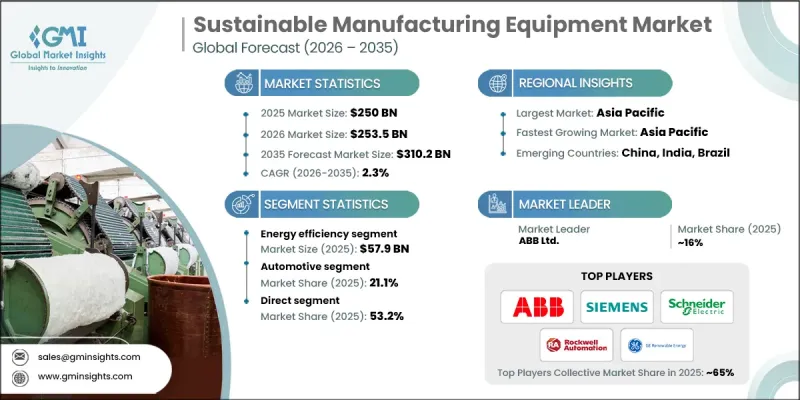
The Global Sustainable Manufacturing Equipment Market was valued at USD 250 billion in 2025 and is estimated to grow at a CAGR of 2.3% to reach USD 310.2 billion by 2035.
The rising adoption of circular economy principles across industrial sectors influences market growth. Manufacturers are increasingly focused on improving resource efficiency, reducing material waste, and extending product life cycles, which directly increases demand for advanced equipment designed to support these goals. Sustainable manufacturing equipment enables companies to lower raw material dependency while improving cost efficiency through reuse and recycling-driven production models. This shift is not only environmentally driven but also financially motivated, as organizations seek long-term savings and new revenue opportunities from secondary material streams. At the same time, public-sector regulations worldwide are accelerating the adoption of environmentally responsible manufacturing practices. Governments are encouraging the transition through supportive policy frameworks and financial mechanisms that ease the investment burden associated with greener technologies. These measures are pushing manufacturers to modernize production infrastructure and prioritize sustainability as a core operational objective. As environmental compliance, efficiency, and profitability become increasingly interconnected, sustainable manufacturing equipment continues to gain traction as a strategic investment across global industries.
| Market Scope | |
|---|---|
| Start Year | 2025 |
| Forecast Year | 2026-2035 |
| Start Value | $250 Billion |
| Forecast Value | $310.2 Billion |
| CAGR | 2.3% |
The energy efficiency segment generated USD 57.9 billion in 2025 and is expected to grow at a CAGR of 1.2% from 2026 to 2035. Energy-efficient equipment maintains strong adoption due to its applicability across multiple industries, immediate operational savings, and alignment with emissions reduction targets. Companies are actively upgrading machinery to reduce energy consumption and operating expenses while improving overall performance.
The direct segment held 53.2% share in 2024. Direct sales models allow equipment manufacturers to engage end users without intermediaries, enabling clearer communication of sustainability benefits such as lower emissions, improved efficiency, and recyclability while strengthening long-term customer relationships.
U.S. Sustainable Manufacturing Equipment Market reached USD 44.8 billion in 2025 and is projected to grow at a CAGR of 1.6% through 2035. Market leadership is supported by a strong industrial foundation, advanced innovation capabilities, and policy-driven encouragement of environmentally responsible production. U.S.-based manufacturers are early adopters of sustainable equipment as they align operations with regulatory expectations and corporate sustainability objectives.
Major companies operating in the Global Sustainable Manufacturing Equipment Market include Siemens AG, Schneider Electric SE, ABB Ltd., Rockwell Automation, Inc., Mitsubishi Electric Corporation, Honeywell International Inc., Emerson Electric Co., Atlas Copco AB, FANUC Corporation, Bosch Rexroth AG, Yaskawa Electric Corporation, General Electric Company, Tetra Pak International S.A., Veolia Environment S.A., and 3D Systems Corporation. Companies in the Sustainable Manufacturing Equipment Market are reinforcing their competitive position through continuous technology innovation and sustainability-focused product development. Many players are investing in automation, digital monitoring, and energy-optimized system designs to improve efficiency and reduce lifecycle costs. Strategic partnerships with industrial clients help tailor equipment to sector-specific sustainability goals. Firms are expanding global manufacturing and service networks to support faster deployment and localized compliance requirements.
Table of Contents
Chapter 1 Methodology & Scope
- 1.1 Market scope & definitions
- 1.2 Research design
- 1.2.1 Research approach
- 1.2.2 Data collection methods
- 1.3 Base estimates and calculations
- 1.3.1 Base year calculation
- 1.3.2 Market estimates & forecasts parameters
- 1.4 Forecast Model
- 1.4.1 Key trends for market estimates
- 1.4.2 Quantified market impact analysis
- 1.4.2.1 Mathematical impact of growth parameters on forecast
- 1.4.3 Scenario analysis framework
- 1.5 Primary research and validation
- 1.5.1 Some of the primary sources (but not limited to)
- 1.6 Data mining sources
- 1.6.1 Paid Sources
- 1.7 Primary research and validation
- 1.7.1 Primary sources
- 1.8 Research Trail & confidence scoring
- 1.8.1 Research trail components
- 1.8.2 Scoring components
- 1.9 Research transparency addendum
- 1.9.1 Source attribution framework
- 1.9.2 Quality assurance metrics
- 1.9.3 Our commitment to trust
- 1.10 Market Definitions
Chapter 2 Executive Summary
- 2.1 Industry 360° synopsis
- 2.2 Key market trends
- 2.2.1 Regional
- 2.2.2 Product Type
- 2.2.3 Automation
- 2.2.4 Application
- 2.2.5 Distribution channel
- 2.3 CXO perspectives: Strategic imperatives
- 2.3.1 Key decision points for industry executives
- 2.3.2 Critical success factors for market players
- 2.4 Future outlook and strategic recommendations
Chapter 3 Industry Insights
- 3.1 Industry ecosystem analysis
- 3.1.1 Supplier landscape
- 3.1.2 Profit margin
- 3.1.3 Value addition at each stage
- 3.1.4 Factor affecting the value chain
- 3.2 Industry impact forces
- 3.2.1 Growth drivers
- 3.2.1.1 Corporate commitments to net-zero emissions
- 3.2.1.2 Adoption of circular economy principles
- 3.2.1.3 Government regulations and incentives
- 3.2.2 Pitfalls & Challenges
- 3.2.2.1 High initial investment costs
- 3.2.2.2 Complexity of regulatory compliance
- 3.2.3 Opportunities
- 3.2.3.1 Growing demand for energy-efficient and low-emission equipment
- 3.2.3.2 Integration of circular economy principles
- 3.2.1 Growth drivers
- 3.3 Growth potential analysis
- 3.4 Future market trends
- 3.5 Technology and innovation landscape
- 3.5.1 Current technological trends
- 3.5.2 Emerging technologies
- 3.6 Price trends
- 3.6.1 By region
- 3.6.2 By product
- 3.7 Regulatory landscape
- 3.7.1 North America
- 3.7.1.1 US: Consumer Product Safety Commission (CPSC) 16 Code of Federal Regulations (CFR) part 1512
- 3.7.1.2 Canada: International Organization for Standardization (ISO) 4210
- 3.7.2 Europe
- 3.7.2.1 Germany: Deutsches Institut fur Normung (DIN) European Norm (EN) ISO 4210
- 3.7.2.2 UK: European Norm (EN) ISO 4210 / United Kingdom Conformity Assessed (UKCA)
- 3.7.2.3 France: European Norm (EN) ISO 4210
- 3.7.3 Asia Pacific
- 3.7.3.1 China: Guobiao (GB) 3565
- 3.7.3.2 India: Indian Standard (IS) 10613
- 3.7.3.3 Japan: Japanese Industrial Standard (JIS) D 9110
- 3.7.4 Latin America
- 3.7.4.1 Brazil: Associacao Brasileira de Normas Tecnicas (ABNT) Norma Brasileira (NBR) ISO 4210
- 3.7.4.2 Mexico: International Organization for Standardization (ISO) 4210
- 3.7.5 Middle East & Africa
- 3.7.5.1 South Africa: South African National Standard (SANS) 311
- 3.7.5.2 Saudi Arabia: Saudi Standards, Metrology and Quality Organization (SASO) Gulf Standardization Organization (GSO) ISO 4210
- 3.7.1 North America
- 3.8 Trade statistics
- 3.8.1 Major importing countries
- 3.8.2 Major exporting countries
- 3.9 Porter's analysis
- 3.10 PESTEL analysis
Chapter 4 Competitive Landscape, 2025
- 4.1 Introduction
- 4.2 Company market share analysis
- 4.2.1 By Region
- 4.2.1.1 North America
- 4.2.1.2 Europe
- 4.2.1.3 Asia Pacific
- 4.2.1.4 Latin America
- 4.2.1.5 Middle East & Africa
- 4.2.1 By Region
- 4.3 Company matrix analysis
- 4.4 Competitive analysis of major market players
- 4.5 Competitive positioning matrix
- 4.6 Key developments
- 4.6.1 Mergers & acquisitions
- 4.6.2 Partnerships & collaborations
- 4.6.3 New product launches
- 4.6.4 Expansion plans
Chapter 5 Market Estimates & Forecast, By Equipment Type, 2022 - 2035, (USD Billion) (Thousand Units)
- 5.1 Key trends
- 5.2 Energy-efficient machinery
- 5.3 Waste management equipment
- 5.4 Water & wastewater treatment equipment
- 5.5 Carbon emission control systems
- 5.6 Renewable energy integration equipment
- 5.7 Smart manufacturing & monitoring equipment
- 5.8 Sustainable packaging equipment
- 5.9 Additive manufacturing equipment
- 5.10 Others (material recovery systems, etc.)
Chapter 6 Market Estimates & Forecast, By End User Industry, 2022 - 2035, (USD Billion) (Thousand Units)
- 6.1 Key trends
- 6.2 Automotive
- 6.3 Electronics and semiconductors
- 6.4 Food and beverages
- 6.5 Chemical manufacturing
- 6.6 Pharmaceuticals
- 6.7 Metals and mining
- 6.8 Consumer goods
- 6.9 Others (textile manufacturing, etc.)
Chapter 7 Market Estimates & Forecast, By End Use, 2022 - 2035, (USD Billion) (Thousand Units)
- 7.1 Key trends
- 7.2 Large enterprises
- 7.3 Small & medium enterprises (SMEs)
- 7.4 Government & research institutes
- 7.5 Sustainable manufacturing startups
Chapter 8 Market Estimates & Forecast, By Distribution Channel, 2022 - 2035, (USD Billion) (Thousand Units)
- 8.1 Key trends
- 8.2 Direct
- 8.3 Indirect
Chapter 9 Market Estimates & Forecast, By Region, 2022 - 2035, (USD Billion) (Thousand Units)
- 9.1 Key trends
- 9.2 North America
- 9.2.1 U.S.
- 9.2.2 Canada
- 9.3 Europe
- 9.3.1 Germany
- 9.3.2 UK
- 9.3.3 France
- 9.3.4 Italy
- 9.3.5 Spain
- 9.4 Asia Pacific
- 9.4.1 China
- 9.4.2 India
- 9.4.3 Japan
- 9.4.4 South Korea
- 9.4.5 Australia
- 9.5 Latin America
- 9.5.1 Brazil
- 9.5.2 Mexico
- 9.5.3 Argentina
- 9.6 MEA
- 9.6.1 Saudi Arabia
- 9.6.2 UAE
- 9.6.3 South Africa
Chapter 10 Company Profiles
- 10.1 3D Systems Corporation
- 10.2 ABB Ltd.
- 10.3 Atlas Copco AB
- 10.4 Bosch Rexroth AG
- 10.5 Emerson Electric Co.
- 10.6 FANUC Corporation
- 10.7 General Electric (GE) Company
- 10.8 Honeywell International Inc.
- 10.9 Mitsubishi Electric Corporation
- 10.10 Rockwell Automation, Inc.
- 10.11 Schneider Electric SE
- 10.12 Siemens AG
- 10.13 Tetra Pak International S.A.
- 10.14 Veolia Environment S.A.
- 10.15 Yaskawa Electric Corporation

