
PUBLISHER: Global Market Insights Inc. | PRODUCT CODE: 1936643

PUBLISHER: Global Market Insights Inc. | PRODUCT CODE: 1936643
Carbon Credit Market Opportunity, Growth Drivers, Industry Trend Analysis, and Forecast 2026 - 2035
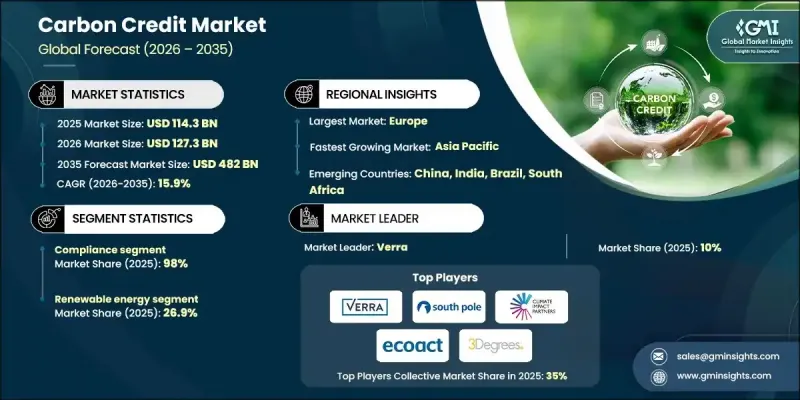
The Global Carbon Credit Market was valued at USD 114.3 billion in 2025 and is estimated to grow at a CAGR of 15.9% to reach USD 482 billion by 2035.
Market growth is driven by tightening global climate regulations, rising corporate net-zero commitments, and increasing adoption of market-based mechanisms to reduce greenhouse gas emissions. Carbon credits have emerged as a critical financial instrument enabling governments and corporations to offset emissions while supporting climate mitigation projects such as renewable energy, reforestation, and methane capture. The growing integration of carbon markets into national climate policies and emissions trading systems is enhancing market transparency and liquidity. Additionally, increasing pressure from investors and consumers for environmental accountability is compelling organizations to actively participate in carbon credit trading as part of long-term sustainability strategies.
| Market Scope | |
|---|---|
| Start Year | 2025 |
| Forecast Year | 2026-2035 |
| Start Value | $114.3 Billion |
| Forecast Value | $482 Billion |
| CAGR | 15.9% |
Based on type, the compliance carbon credits segment held 98% share in 2025, owing to mandatory emission reduction frameworks under regulated emissions trading schemes. Compliance markets are primarily driven by strict regulatory mandates imposed on power generation, manufacturing, and heavy industrial sectors to limit carbon emissions. These credits provide regulated entities with flexibility to meet emission targets while maintaining operational continuity. The segment benefits from standardized verification mechanisms, government oversight, and predictable demand, making compliance carbon credits a cornerstone of global decarbonization efforts.
The renewable energy segment held 26.9% share in 2025, driven by large-scale investments in wind, solar, hydro, and bioenergy projects aimed at reducing dependence on fossil fuels. Renewable energy projects generate carbon credits by displacing carbon-intensive power generation, making them highly attractive for both compliance and voluntary markets. Utilities, independent power producers, and project developers increasingly monetize these credits to improve project viability and secure additional revenue streams. The segment benefits from strong policy support, long-term power purchase agreements, and growing corporate demand for clean energy-backed offsets.
Europe Carbon Credit Market will grow at a CAGR of 15.9% through 2026-2035, supported by the well-established EU Emissions Trading System (EU ETS). The region benefits from stringent climate regulations, advanced monitoring frameworks, and strong political commitment toward carbon neutrality. European industries actively participate in carbon trading to comply with emission caps while optimizing operational costs. The expansion of cross-border trading mechanisms and integration of additional sectors into the EU ETS continue to strengthen Europe's leadership in the global carbon credit ecosystem.
Key players operating in the Global Carbon Credit Market include Verra, Gold Standard Foundation, Climate Impact X, South Pole, Carbon Trust, EcoAct, Shell plc, BP plc, TotalEnergies, and ENGIE, among others. These companies focus on project development, credit certification, digital trading platforms, and corporate decarbonization advisory services to expand their market footprint. Companies in the Carbon Credit Market are strengthening their market position through strategic investments in high-integrity carbon projects, digital trading platforms, and verification technologies. Leading players focus on expanding renewable energy, forestry, and nature-based projects to ensure long-term credit availability and quality. Partnerships with governments, corporates, and financial institutions help scale trading volumes and improve market transparency. Firms are also leveraging blockchain and AI-driven monitoring tools to enhance traceability, prevent double-counting, and build buyer confidence.
Table of Contents
Chapter 1 Methodology & Scope
- 1.1 Research approach
- 1.2 Quality commitment
- 1.2.1 GMI AI policy & data integrity commitment
- 1.2.1.1 Source consistency protocol
- 1.2.1 GMI AI policy & data integrity commitment
- 1.3 Research Trail & Confidence Scoring
- 1.3.1 Research Trail Components
- 1.3.2 Scoring Components
- 1.4 Data Collection
- 1.4.1 Partial list of primary sources
- 1.5 Data mining sources
- 1.5.1 Paid sources
- 1.5.1.1 Sources, by region
- 1.5.1 Paid sources
- 1.6 Base estimates and calculations
- 1.6.1 Base year calculation for any one approach
- 1.7 Forecast model
- 1.8 Research transparency addendum
- 1.8.1 Source attribution framework
- 1.8.2 Quality assurance metrics
- 1.8.3 Our commitment to trust
- 1.9 Market definitions
Chapter 2 Executive Summary
- 2.1 Industry synopsis, 2022 - 2035
- 2.1.1 Business trends
- 2.1.2 Type trends
- 2.1.3 Source trends
- 2.1.4 Regional trends
Chapter 3 Industry Insights
- 3.1 Industry ecosystem analysis
- 3.2 Regulatory landscape
- 3.3 Industry impact forces
- 3.3.1 Growth drivers
- 3.3.2 Industry pitfalls & challenges
- 3.4 Growth potential analysis
- 3.5 Porter's analysis
- 3.5.1 Bargaining power of suppliers
- 3.5.2 Bargaining power of buyers
- 3.5.3 Threat of new entrants
- 3.5.4 Threat of substitutes
- 3.6 PESTEL analysis
- 3.6.1 Political factors
- 3.6.2 Economic factors
- 3.6.3 Social factors
- 3.6.4 Technology factors
- 3.6.5 environmental factors
- 3.6.6 Legal factors
- 3.7 Emerging opportunities & trends
- 3.7.1 Digitalization and IoT integration
- 3.7.2 Emerging market penetration
Chapter 4 Competitive landscape, 2025
- 4.1 Introduction
- 4.2 Company market share analysis, 2025
- 4.2.1 North America
- 4.2.2 Europe
- 4.2.3 Asia Pacific
- 4.2.4 Middle East & Africa
- 4.2.5 Latin America
- 4.3 Strategic initiatives
- 4.4 Competitive benchmarking
- 4.5 Strategic dashboard
- 4.6 Innovation & technology landscape
Chapter 5 Market Size and Forecast, By Type, 2022 - 2035 (USD Million)
- 5.1 Key trends
- 5.2 Voluntary
- 5.3 Compliance
Chapter 6 Market Size and Forecast, By Source, 2022 - 2035 (USD Million)
- 6.1 Key trends
- 6.2 Agriculture
- 6.3 Carbon capture & storage
- 6.4 Chemical process
- 6.5 Energy efficiency
- 6.6 Industrial
- 6.7 Forestry & land use
- 6.8 Renewable energy
- 6.9 Transportation
- 6.10 Waste management
- 6.11 Others
Chapter 7 Market Size and Forecast, By Region, 2022 - 2035 (USD Million)
- 7.1 Key trends
- 7.2 North America
- 7.3 Europe
- 7.4 Asia Pacific
- 7.5 Middle East & Africa
- 7.6 Latin America
Chapter 8 Company Profiles
- 8.1 3Degrees
- 8.2 Allcot
- 8.3 Atmosfair
- 8.4 Carbon Clear
- 8.5 Carbon Collective Company
- 8.6 Carbon Credit Capital
- 8.7 Carbonmark
- 8.8 Carbonplace
- 8.9 Climate Impact Partners
- 8.10 Climeco
- 8.11 EcoAct
- 8.12 Ecosecurities
- 8.13 Green Mountain Energy
- 8.14 Shell
- 8.15 South Pole
- 8.16 Sterling Planet
- 8.17 Terrapass
- 8.18 The Carbon Trust
- 8.19 Verra
- 8.20 WGL Holdings

