
PUBLISHER: Global Market Insights Inc. | PRODUCT CODE: 1959295

PUBLISHER: Global Market Insights Inc. | PRODUCT CODE: 1959295
North America E-bikes Market Opportunity, Growth Drivers, Industry Trend Analysis, and Forecast 2026 - 2035
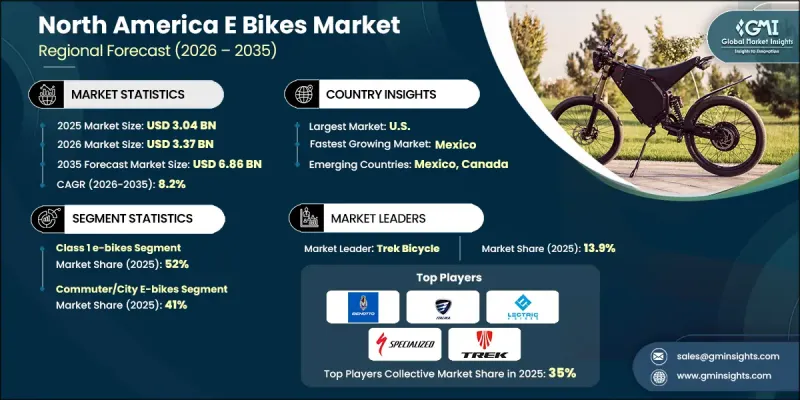
North America E-bikes Market was valued at USD 3.04 billion in 2025 and is estimated to grow at a CAGR of 8.2% to reach USD 6.86 billion by 2035.
The rapid adoption of electric bicycles across the region is redefining urban transportation, leisure cycling, and last-mile delivery networks. E-bikes equipped with advanced electric drivetrains, rechargeable lithium-ion battery systems, intelligent controllers, and integrated electronics are emerging as efficient substitutes for conventional fuel-powered vehicles for short and mid-range travel. Their ability to lower commuting expenses, decrease carbon emissions, and ease traffic congestion has shifted their perception from recreational products to essential mobility solutions. As cities modernize transportation frameworks and prioritize sustainable transit, e-bikes are becoming embedded in broader infrastructure planning and supply chain strategies. Consumer demand is fueled by convenience, improved product reliability, and greater acceptance of electric mobility, positioning the North America e-bikes market as a high-growth segment within the regional transportation landscape.
| Market Scope | |
|---|---|
| Start Year | 2025 |
| Forecast Year | 2026-2035 |
| Start Value | $3.04 Billion |
| Forecast Value | $6.86 Billion |
| CAGR | 8.2% |
Core system components, including drive units, battery modules, control systems, sensors, and lightweight frame engineering, now define overall product performance, durability, and regulatory alignment. Manufacturers are transitioning from modifying traditional bicycles to developing fully integrated electric platforms where hardware and software function as cohesive systems. This integration directly influences ride range, maintenance cycles, cost efficiency, and product differentiation across commuter, cargo, and recreational categories. Increased capital investment and strategic alliances among bicycle brands, battery developers, electronics firms, and digital solution providers are strengthening innovation pipelines. Vertical integration initiatives such as internal battery assembly, proprietary motor calibration, and domestic final assembly operations are enabling tighter quality control, cost management, and compliance with evolving safety standards.
The class 1 e-bikes segment accounted for 52% share in 2025 and is anticipated to grow at a CAGR of 7.2% through 2035. This category leads the industry due to broad regulatory acceptance and its suitability for everyday transportation needs. Class 1 models provide pedal-assist functionality with assisted speeds capped at 20 mph, allowing compatibility with most cycling infrastructure. This regulatory consistency enhances consumer confidence and supports adoption among commuters and recreational users. Additionally, these models closely mirror the experience of traditional bicycles while delivering enhanced endurance and reduced physical strain, making them appealing to a wide demographic range.
The commuter and city e-bike segment held 41% share in 2025 and is forecast to grow at a CAGR of 8.7% from 2026 to 2035. Urban congestion, escalating transportation costs, and demand for efficient point-to-point mobility solutions are key drivers supporting this segment. Commuter e-bikes offer a balanced combination of performance, battery range, and ergonomic comfort, making them ideal for daily travel. Their integration into established cycling networks further accelerates uptake in metropolitan areas. The segment attracts a diverse customer base, including professionals, first-time riders, and older consumers seeking dependable alternatives to automobiles and public transit.
US E-bikes Market is expected to demonstrate strong and sustained growth between 2026 and 2035. Expansion is supported by rising interest in environmentally responsible mobility options and increasing consumer awareness of cost-efficient transportation alternatives. Growing traffic density and fluctuating fuel costs are encouraging individuals to consider electric bicycles for routine travel. Continuous improvements in battery capacity, motor optimization, and digital ride management systems have enhanced overall performance and user experience, broadening market appeal. Government-backed incentives, funding initiatives, and infrastructure development programs that promote cycling and active mobility are further reinforcing market expansion across the country.
Key companies operating in the North America E-bikes Market include Trek Bicycle, Rad Power Bike, Specialized Bicycle Components, Aventon, Cannondale, Pedego, Lectric eBikes, Yuba Bicycles, Benotto, and Italika. These industry participants are competing through innovation, distribution expansion, and differentiated product offerings tailored to diverse rider preferences. Companies in the North America E-bikes Market are strengthening their competitive position by investing in advanced battery technologies, lightweight materials, and integrated digital connectivity features. Strategic partnerships with component suppliers and technology firms are accelerating product innovation and reducing time to market. Many manufacturers are expanding domestic assembly operations to improve supply chain resilience and meet regional compliance standards. Direct-to-consumer sales models, expanded dealership networks, and after-sales service enhancements are improving brand loyalty and customer retention.
Table of Contents
Chapter 1 Methodology
- 1.1 Research approach
- 1.2 Quality commitments
- 1.2.1 GMI AI policy & data integrity commitment
- 1.3 Research trail & confidence scoring
- 1.3.1 Research trail components
- 1.3.2 Scoring components
- 1.4 Data collection
- 1.4.1 Partial list of primary sources
- 1.5 Data mining sources
- 1.5.1 Paid sources
- 1.6 Base estimates and calculations
- 1.6.1 Base year calculation
- 1.7 Forecast model
- 1.8 Research transparency addendum
Chapter 2 Executive Summary
- 2.1 Industry 360° synopsis, 2022 - 2035
- 2.2 Key market trends
- 2.2.1 Regional
- 2.2.2 Class
- 2.2.3 Product
- 2.2.4 Sales Channel
- 2.2.5 Motor
- 2.2.6 End Use
- 2.3 TAM Analysis, 2026-2035
- 2.4 CXO perspectives: Strategic imperatives
- 2.4.1 Executive decision points
- 2.4.2 Critical success factors
- 2.5 Future outlook and strategic recommendations
Chapter 3 Industry Insights
- 3.1 Industry ecosystem analysis
- 3.1.1 Supplier landscape
- 3.1.2 Profit margin analysis
- 3.1.3 Cost structure
- 3.1.4 Value addition at each stage
- 3.1.5 Factor affecting the value chain
- 3.1.6 Disruptions
- 3.2 Industry impact forces
- 3.2.1 Growth drivers
- 3.2.1.1 Increase in government incentives and rebates
- 3.2.1.2 Surge in urban commuting and micromobility adoption
- 3.2.1.3 Rise in fuel prices and transportation costs
- 3.2.1.4 Increase in health and wellness awareness
- 3.2.2 Industry pitfalls and challenges
- 3.2.2.1 High initial purchase cost
- 3.2.2.2 Limited public charging infrastructure
- 3.2.3 Market opportunities
- 3.2.3.1 Rise in demand for cargo and utility e-bikes
- 3.2.3.2 Increase in e-bike sharing and subscription services
- 3.2.3.3 Growth in integration with public transit systems
- 3.2.3.4 Increase in municipal infrastructure projects
- 3.2.1 Growth drivers
- 3.3 Growth potential analysis
- 3.4 Regulatory landscape
- 3.4.1 North America
- 3.4.1.1 US
- 3.4.1.1.1 CPSC E-Bike Classification & Safety Standards
- 3.4.1.1.2 California Air Resources Board (CARB) E-Bike Incentive Program
- 3.4.1.1.3 New York Shared Micromobility Regulations
- 3.4.1.1.4 Colorado Mountain Trail Access Policies
- 3.4.1.1.5 Florida Urban Cycling Infrastructure GuidelinesCanada
- 3.4.1.2 Canada
- 3.4.1.2.1 Canada Motor Vehicle Safety Standard (CMVSS) - E-Bike Classification
- 3.4.1.2.2 Provincial Helmet & Licensing Guidelines (Ontario, Quebec, British Columbia)
- 3.4.1.3 Mexico
- 3.4.1.3.1 Municipal Micromobility Pilot Programs
- 3.4.1.3.2 Traffic Code Adaptations for Low-Speed E-Bikes
- 3.4.1.3.3 Bike Lane & Rider Safety Standards
- 3.4.1.1 US
- 3.4.1 North America
- 3.5 Porter’s analysis
- 3.6 PESTEL analysis
- 3.7 Technology and Innovation landscape
- 3.7.1 Current technological trends
- 3.7.1.1 Lithium-ion Battery Advancements
- 3.7.1.2 Motor Efficiency Improvements
- 3.7.1.3 Regenerative Braking Systems and Energy Recovery
- 3.7.1.4 Smart Charging Infrastructure and Fast-Charging Capabilities
- 3.7.2 Emerging technologies
- 3.7.2.1 AI-powered Adaptive Assistance and Predictive Maintenance
- 3.7.2.2 IoT Connectivity and V2X (Vehicle-to-Everything) Integration
- 3.7.2.3 Blockchain-based Ownership Verification and Anti-theft Systems
- 3.7.2.4 Advanced Materials (Carbon Fiber, Graphene Applications)
- 3.7.2.5 Wireless Charging and Solar Integration Technologies
- 3.7.1 Current technological trends
- 3.8 Patent analysis
- 3.9 Sustainability and environmental impact analysis
- 3.9.1 Sustainable practices
- 3.9.2 Waste reduction strategies
- 3.9.3 Energy efficiency in production
- 3.9.4 Eco-friendly initiatives
- 3.9.5 Carbon footprint considerations
- 3.10 Price Trends
- 3.10.1 By Region
- 3.10.2 By Product
- 3.11 Production Statistics
- 3.11.1 Production Hubs
- 3.11.2 Consumption Hubs
- 3.11.3 Export and Import
- 3.12 Cost Breakdown Analysis
- 3.12.1 Raw Material Cost Analysis
- 3.12.2 Manufacturing and Operational Cost Analysis
- 3.12.3 Total Cost of Ownership (TCO) and Lifecycle Cost Analysis
- 3.13 Sustainability and Environmental Aspects
- 3.13.1 Sustainable Practices
- 3.13.2 Waste Reduction Strategies
- 3.13.3 Energy Efficiency in Production
- 3.13.4 Eco-Friendly Initiatives
- 3.13.5 Carbon Footprint Considerations
- 3.14 User Demand and Scenario Analysis, 2025
- 3.14.1 Demographics of E-bike Buyers
- 3.14.1.1 Age Distribution
- 3.14.1.2 Gender Breakdown
- 3.14.1.3 Income Levels
- 3.14.1.4 Geographic Distribution
- 3.14.2 Online Shopper Behaviour Analysis
- 3.14.2.1 Price Sensitivity
- 3.14.2.2 Research Patterns
- 3.14.2.3 Review Dependency
- 3.14.2.4 Mobile vs Desktop
- 3.14.2.5 Seasonal Purchasing
- 3.14.1 Demographics of E-bike Buyers
- 3.15 Consumer Insights and Preferences, 2025
- 3.15.1 Preferred Buying Factors
- 3.15.2 Battery Life and Range
- 3.15.3 Price and Value Proposition
- 3.15.4 Brand Reputation and Reviews
- 3.15.5 Speed and Performance Capabilities
- 3.15.6 Warranty Coverage and Duration
- 3.15.7 After-Sales Service Availability
- 3.15.8 Design and Aesthetic
Chapter 4 Competitive Landscape, 2025
- 4.1 Introduction
- 4.2 Company market share analysis
- 4.2.1 US
- 4.2.2 Canada
- 4.2.3 Mexico
- 4.3 Competitive analysis of major market players
- 4.4 Competitive positioning matrix
- 4.5 Strategic outlook matrix
- 4.6 Key developments
- 4.6.1 Mergers & acquisitions
- 4.6.2 Partnerships & collaborations
- 4.6.3 New Product Launches
- 4.6.4 Expansion Plans and funding
- 4.7 Company-Level Benchmarking
- 4.7.1 Product and Technology Offerings
- 4.7.1.1 Performance Specifications Heatmap
- 4.7.1.2 Feature Comparison Dashboard
- 4.7.2 Brand and Customer Positioning
- 4.7.2.1 Target Customer Segments
- 4.7.2.2 Brand Perception
- 4.7.3 After-Sales and Service
- 4.7.3.1 Warranty and Support
- 4.7.3.2 Service Infrastructure
- 4.7.1 Product and Technology Offerings
- 4.8 Competitive Positioning Matrix
- 4.9 Strategic Outlook Matrix
Chapter 5 Market Estimates & Forecast, By Class, 2022 - 2035 ($Bn, Units)
- 5.1 Key trends
- 5.2 Class 1 E-bikes
- 5.3 Class 2 E-bikes
- 5.4 Class 3 E-bikes
Chapter 6 Market Estimates & Forecast, By Product, 2022 - 2035 ($Bn, Units)
- 6.1 Key trends
- 6.2 Cargo E-bikes
- 6.3 Folding E-bikes
- 6.4 Commuter/City E-bikes
- 6.5 Mountain E-bikes (eMTB)
- 6.6 Fat-tire E-bikes
- 6.7 Hybrid/Cruiser E-bikes
Chapter 7 Market Estimates & Forecast, By Motor, 2022 - 2035 ($Bn, Units)
- 7.1 Key trends
- 7.2 Hub Motor
- 7.3 Mid-Drive
Chapter 8 Market Estimates & Forecast, By End Use, 2022 - 2035 ($Bn, Units)
- 8.1 Key trends
- 8.2 Commuting/daily transportation
- 8.3 Recreation/leisure
- 8.4 Delivery/commercial applications
Chapter 9 Market Estimates & Forecast, By Region, 2022 - 2035 ($Bn, Units)
- 9.1 Key trends
- 9.2 US
- 9.2.1 Northeast
- 9.2.1.1 Connecticut
- 9.2.1.2 Maine
- 9.2.1.3 Massachusetts
- 9.2.1.4 New Hampshire
- 9.2.1.5 New Jersey
- 9.2.1.6 New York
- 9.2.1.7 Pennsylvania
- 9.2.1.8 Rhode Island
- 9.2.1.9 Vermont
- 9.2.2 Southeast
- 9.2.2.1 Alabama
- 9.2.2.2 Arkansas
- 9.2.2.3 Delaware
- 9.2.2.4 Florida
- 9.2.2.5 Georgia
- 9.2.2.6 Kentucky
- 9.2.2.7 Louisiana
- 9.2.2.8 Maryland
- 9.2.2.9 Mississippi
- 9.2.2.10 North Carolina
- 9.2.2.11 South Carolina
- 9.2.2.12 Tennessee
- 9.2.2.13 Virginia
- 9.2.2.14 West Virginia
- 9.2.3 Midwest
- 9.2.3.1 Illinois
- 9.2.3.2 Indiana
- 9.2.3.3 Iowa
- 9.2.3.4 Kansas
- 9.2.3.5 Michigan
- 9.2.3.6 Minnesota
- 9.2.3.7 Missouri
- 9.2.3.8 Nebraska
- 9.2.3.9 North Dakota
- 9.2.3.10 Ohio
- 9.2.3.11 South Dakota
- 9.2.3.12 Wisconsin
- 9.2.4 Southwest
- 9.2.4.1 Arizona
- 9.2.4.2 New Mexico
- 9.2.4.3 Oklahoma
- 9.2.4.4 Texas
- 9.2.5 West
- 9.2.5.1 Alaska
- 9.2.5.2 California
- 9.2.5.3 Colorado
- 9.2.5.4 Hawaii
- 9.2.5.5 Idaho
- 9.2.5.6 Montana
- 9.2.5.7 Nevada
- 9.2.5.8 Oregon
- 9.2.5.9 Utah
- 9.2.5.10 Washington
- 9.2.5.11 Wyoming
- 9.2.1 Northeast
- 9.3 Canada
- 9.3.1 Ontario
- 9.3.2 Quebec
- 9.3.3 British Columbia
- 9.3.4 Alberta
- 9.3.5 Manitoba
- 9.3.6 Other Provinces
- 9.4 Mexico
Chapter 10 Company Profiles
- 10.1 US Players
- 10.1.1 Aventon
- 10.1.2 Blix Bikes
- 10.1.3 Lectric eBikes
- 10.1.4 Magnum Bikes
- 10.1.5 Pedego Electric Bikes
- 10.1.6 QuietKat
- 10.1.7 Ride1UP
- 10.1.8 Specialized Bicycle Components
- 10.1.9 Trek Bicycle
- 10.1.10 Yuba Bicycles
- 10.2 Canada Players
- 10.2.1 Biktrix
- 10.2.2 Devinci Cycles
- 10.2.3 Emmo Canada
- 10.2.4 Envo Bikes (Envo Drive Systems)
- 10.2.5 Eunorau Canada
- 10.2.6 GIO Electric Bikes (GVA Brands)
- 10.2.7 Pedego Canada
- 10.2.8 Surface 604
- 10.2.9 Voltbike
- 10.3 Mexico Players
- 10.3.1 144 Rayos Bikes
- 10.3.2 Benotto
- 10.3.3 Hi-Tek
- 10.3.4 Spinciti
- 10.3.5 Voltax Electric Bikes

