
PUBLISHER: Global Market Insights Inc. | PRODUCT CODE: 1959325

PUBLISHER: Global Market Insights Inc. | PRODUCT CODE: 1959325
Micromobility Swap Station Market Opportunity, Growth Drivers, Industry Trend Analysis, and Forecast 2026 - 2035
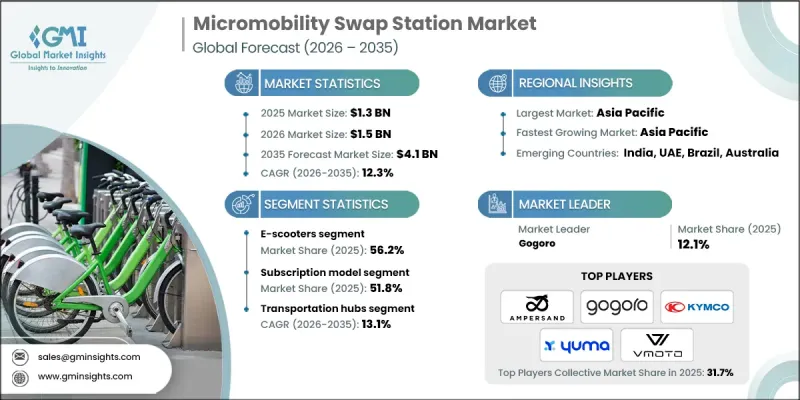
The Global Micromobility Swap Station Market was valued at USD 1.3 billion in 2025 and is estimated to grow at a CAGR of 12.3% to reach USD 4.1 billion by 2035.
Rapid urbanization and smart city development initiatives are driving the adoption of shared electric mobility solutions, including electric scooters, bicycles, and mopeds. These services are increasingly viewed as efficient alternatives to internal combustion engine vehicles, helping users and fleet operators lower ownership costs, reduce emissions, and improve last-mile connectivity. Battery swapping infrastructure has emerged as a critical enabler for this transition by addressing operational challenges linked to charging time and vehicle downtime. While limited charging availability initially constrained electric vehicle deployment, expanding infrastructure networks have significantly improved accessibility and usability. Market participants are strengthening their positions by offering integrated ecosystems that combine vehicles, standardized batteries, and swap station networks. Partnerships with fleet operators and delivery service providers support seamless adoption and improve asset utilization, positioning battery swapping as a scalable and commercially attractive solution within dense urban environments.
| Market Scope | |
|---|---|
| Start Year | 2025 |
| Forecast Year | 2026-2035 |
| Start Value | $1.3 Billion |
| Forecast Value | $4.1 Billion |
| CAGR | 12.3% |
The e-scooters segment accounted for 56.2% share and generated USD 737.7 million in 2025. Strong daily utilization rates across commuting, shared mobility, and delivery operations continue to support segment leadership. Battery swapping aligns well with e-scooter usage patterns due to minimal downtime requirements and high operational frequency. Compact battery design, lighter weight, and modular architecture further support standardization and large-scale deployment across swap networks, reinforcing demand from commercial and shared mobility operators.
The subscription-based pricing model held a 51.8% share in 2025 and is projected to reach USD 2.3 billion by 2035. This approach aligns with frequent battery usage patterns among commuters and professional riders by offering predictable costs and simplified payment structures. A single battery swap typically costs about USD 1 and provides an operating range of roughly 50 kilometers, making subscriptions more economical for high-frequency users compared to transactional pricing. Fixed monthly or annual plans reduce administrative complexity and support consistent revenue streams for service providers.
U.S. Micromobility Swap Station Market generated USD 209.7 million in 2025. Across the country, municipal authorities and private stakeholders are increasingly supporting swap station deployment to enhance the efficiency of shared electric mobility networks. Battery swapping reduces charging-related delays and improves vehicle availability, which is particularly important for delivery professionals and urban riders seeking to maximize daily usage and earnings.
Key companies active in the Global Micromobility Swap Station Market include Gogoro, SUN Mobility, Battery Smart, Swobbee, Yuma, Tycorun, Spiro, Ampersand, KYMCO, and Vmoto. Companies operating in the micromobility swap station market adopt focused strategies to strengthen market presence and competitive positioning. Many invest heavily in standardized battery platforms to ensure interoperability across multiple vehicle types and brands. Strategic collaborations with city authorities, fleet operators, and mobility service providers help accelerate network deployment and user adoption. Firms also expand station density in high-traffic urban areas to improve convenience and reduce range anxiety. Subscription-based pricing and bundled service offerings enhance customer retention and revenue stability.
Table of Contents
Chapter 1 Methodology
- 1.1 Research approach
- 1.2 Quality commitments
- 1.2.1 GMI AI policy & data integrity commitment
- 1.3 Research trail & confidence scoring
- 1.3.1 Research trail components
- 1.3.2 Scoring components
- 1.4 Data collection
- 1.4.1 Partial list of primary sources
- 1.5 Data mining sources
- 1.5.1 Paid sources
- 1.6 Base estimates and calculations
- 1.6.1 Base year calculation
- 1.7 Forecast model
- 1.8 Research transparency addendum
Chapter 2 Executive Summary
- 2.1 Industry 360° synopsis
- 2.2 Key market trends
- 2.2.1 Regional
- 2.2.2 Solution
- 2.2.3 Vehicle
- 2.2.4 Business Model
- 2.2.5 Deployment
- 2.2.6 Application
- 2.2.7 End Use
- 2.3 TAM analysis, 2026-2035
- 2.4 CXO perspectives: Strategic imperatives
- 2.4.1 Executive decision points
- 2.4.2 Critical success factors
- 2.5 Future outlook and recommendations
Chapter 3 Industry Insights
- 3.1 Industry ecosystem analysis
- 3.1.1 Supplier landscape
- 3.1.2 Profit margin
- 3.1.3 Cost structure
- 3.1.4 Value addition at each stage
- 3.1.5 Factor affecting the value chain
- 3.1.6 Disruptions
- 3.2 Industry impact forces
- 3.2.1 Growth drivers
- 3.2.1.1 Growth of smart city and urban mobility initiatives
- 3.2.1.2 Environmental regulations promoting zero-emission transport
- 3.2.1.3 Expansion of shared micromobility services
- 3.2.1.4 Rising demand for fast and convenient battery charging
- 3.2.2 Industry pitfalls and challenges
- 3.2.2.1 High initial capital investment for swap station deployment
- 3.2.2.2 Grid connectivity and power management challenges
- 3.2.3 Market opportunities
- 3.2.3.1 Integration of swap stations with renewable energy sources
- 3.2.3.2 Partnerships with micromobility fleet operators and oems
- 3.2.3.3 Deployment of swap stations at transit hubs and commercial zones
- 3.2.1 Growth drivers
- 3.3 Growth potential analysis
- 3.4 Regulatory landscape
- 3.4.1 North America
- 3.4.1.1 U.S. Department of Transportation (USDOT)
- 3.4.1.2 National Highway Traffic Safety Administration (NHTSA)
- 3.4.1.3 California Air Resources Board (CARB)
- 3.4.1.4 Transport Canada
- 3.4.2 Europe
- 3.4.2.1 European Commission
- 3.4.2.2 UNECE World Forum for Harmonization of Vehicle Regulations (WP.29)
- 3.4.2.3 German Federal Motor Transport Authority (KBA)
- 3.4.2.4 UK Department for Transport (DfT)
- 3.4.2.5 French Ministry of Ecological Transition
- 3.4.3 Asia Pacific
- 3.4.3.1 Ministry of Industry and Information Technology (MIIT), China
- 3.4.3.2 Ministry of Road Transport and Highways (MoRTH), India
- 3.4.3.3 Land Transport Authority (LTA), Singapore
- 3.4.3.4 National Transport Commission (NTC), Australia
- 3.4.4 Latin America
- 3.4.4.1 Brazilian National Land Transport Agency (ANTT)
- 3.4.4.2 Brazilian Association of Automotive Vehicle Manufacturers (ANFAVEA)
- 3.4.4.3 Chile Ministry of Transport and Telecommunications
- 3.4.5 Middle East & Africa
- 3.4.5.1 Dubai Roads and Transport Authority (RTA)
- 3.4.5.2 Abu Dhabi Department of Municipalities and Transport (DMT)
- 3.4.5.3 Saudi Ministry of Transport & Logistics
- 3.4.5.4 South African Department of Transport
- 3.4.1 North America
- 3.5 Porter’s analysis
- 3.6 PESTEL analysis
- 3.7 Technology and innovation landscape
- 3.7.1 Current technological trends
- 3.7.2 Emerging technologies
- 3.8 Price trends
- 3.8.1 By region
- 3.8.2 By product
- 3.9 Cost breakdown analysis
- 3.10 Sustainability and environmental impact
- 3.10.1 Environmental impact assessment
- 3.10.2 Social impact & community benefits
- 3.10.3 Governance & corporate responsibility
- 3.10.4 Sustainable finance & investment trends
- 3.11 Infrastructure readiness and urban integration
- 3.11.1 Urban infrastructure assessment framework
- 3.11.2 Smart city integration opportunities
- 3.11.3 Public transport connectivity
- 3.11.4 Digital infrastructure requirements
- 3.11.5 5G and IoT connectivity readiness
- 3.12 Placement and location strategy
- 3.12.1 Location selection criteria and decision framework
- 3.12.2 Geographic Information System analysis
- 3.12.3 Foot traffic and demand density mapping
- 3.12.4 Safety and security considerations
- 3.12.5 Franchise versus company-owned location models
- 3.13 Grid and power infrastructure analysis
- 3.13.1 Electrical grid capacity assessment
- 3.13.2 Grid connection requirements
- 3.13.3 Load management and peak shaving
- 3.13.4 Distributed energy resources integration
- 3.13.5 Power quality and reliability
- 3.14 Case studies
- 3.15 Future outlook & opportunities
Chapter 4 Competitive Landscape, 2025
- 4.1 Introduction
- 4.2 Company market share analysis
- 4.2.1 North America
- 4.2.2 Europe
- 4.2.3 Asia Pacific
- 4.2.4 LATAM
- 4.2.5 MEA
- 4.3 Competitive analysis of major market players
- 4.4 Competitive positioning matrix
- 4.5 Strategic outlook matrix
- 4.6 Key developments
- 4.6.1 Mergers & acquisitions
- 4.6.2 Partnerships & collaborations
- 4.6.3 New product launches
- 4.6.4 Expansion plans and funding
Chapter 5 Market Estimates & Forecast, By Solution, 2022 - 2035 ($Mn)
- 5.1 Key trends
- 5.2 Battery swap station
- 5.3 Vehicle swap station
Chapter 6 Market Estimates & Forecast, By Vehicle, 2022 - 2035 ($Mn)
- 6.1 Key trends
- 6.2 E-scooters
- 6.3 E-bikes
- 6.4 E-mopeds
- 6.5 Others
Chapter 7 Market Estimates & Forecast, By Business Model, 2022 - 2035 ($Mn)
- 7.1 Key trends
- 7.2 Subscription model
- 7.3 Pay-per-swap
- 7.4 Others
Chapter 8 Market Estimates & Forecast, By Deployment, 2022 - 2035 ($Mn)
- 8.1 Key trends
- 8.2 Public places
- 8.3 Commercial locations
- 8.4 Residential areas
- 8.5 Transportation hubs
Chapter 9 Market Estimates & Forecast, By Application, 2022 - 2035 ($Mn)
- 9.1 Key trends
- 9.2 Ride sharing
- 9.3 Delivery and logistics
- 9.4 Personal commuting
- 9.5 Tourism and recreation
- 9.6 Others
Chapter 10 Market Estimates & Forecast, By End Use, 2022 - 2035 ($Mn)
- 10.1 Key trends
- 10.2 Shared micromobility operators
- 10.3 Individual consumers
- 10.4 Fleet operators
- 10.5 Government and municipal
Chapter 11 Market Estimates & Forecast, By Region, 2022 - 2035 ($Mn)
- 11.1 Key trends
- 11.2 North America
- 11.2.1 US
- 11.2.2 Canada
- 11.3 Europe
- 11.3.1 Germany
- 11.3.2 UK
- 11.3.3 France
- 11.3.4 Italy
- 11.3.5 Spain
- 11.3.6 Czech Republic
- 11.3.7 Belgium
- 11.3.8 Netherlands
- 11.4 Asia Pacific
- 11.4.1 China
- 11.4.2 India
- 11.4.3 Japan
- 11.4.4 South Korea
- 11.4.5 Australia
- 11.4.6 Singapore
- 11.4.7 Malaysia
- 11.4.8 Indonesia
- 11.4.9 Vietnam
- 11.4.10 Thailand
- 11.5 Latin America
- 11.5.1 Brazil
- 11.5.2 Mexico
- 11.5.3 Argentina
- 11.5.4 Colombia
- 11.6 MEA
- 11.6.1 South Africa
- 11.6.2 Saudi Arabia
- 11.6.3 UAE
Chapter 12 Company Profiles
- 12.1 Global players
- 12.1.1 Ampersand
- 12.1.2 Battery Smart
- 12.1.3 Gogoro
- 12.1.4 KYMCO
- 12.1.5 Silence (ACCIONA)
- 12.1.6 Spiro
- 12.1.7 SUN Mobility
- 12.1.8 Swobbee
- 12.1.9 Tycorun
- 12.1.10 Vmoto
- 12.1.11 Yamaha ENYRING
- 12.1.12 Yuma
- 12.2 Regional players
- 12.2.1 BatteryPool
- 12.2.2 ESmito
- 12.2.3 Oyika
- 12.2.4 Popwheels
- 12.2.5 RACEnergy
- 12.2.6 Selex Motors
- 12.2.7 Swap Energi
- 12.2.8 VoltUp
- 12.3 Emerging players
- 12.3.1 ESWAP
- 12.3.2 Okai
- 12.3.3 Terra Tech
- 12.3.4 Tiger New Energy
- 12.3.5 Zembo

