
PUBLISHER: Global Market Insights Inc. | PRODUCT CODE: 1959629

PUBLISHER: Global Market Insights Inc. | PRODUCT CODE: 1959629
Battery Electric Buses Market Opportunity, Growth Drivers, Industry Trend Analysis, and Forecast 2026 - 2035
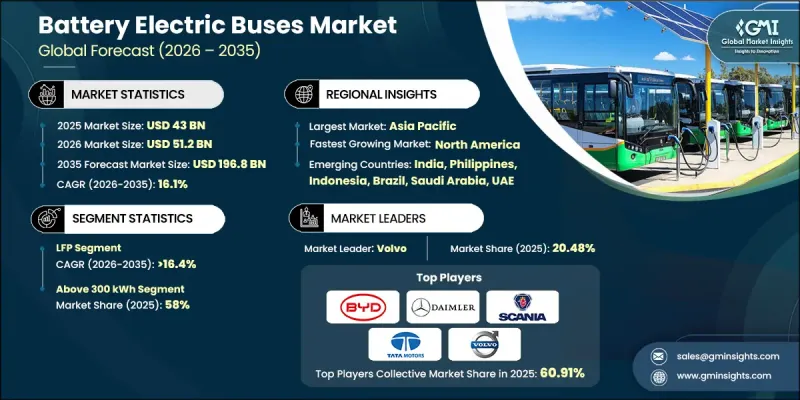
The Global Battery Electric Buses Market was valued at USD 43 billion in 2025 and is estimated to grow at a CAGR of 16.1% to reach USD 196.8 billion in 2035.
The shift toward zero-emission public transportation is transforming the planning, procurement, and operation of urban and intercity bus fleets worldwide. Battery electric buses (BEBs) are becoming central to sustainable mobility initiatives, tackling urban air pollution, greenhouse gas emissions, and noise pollution. Unlike passenger EVs, BEBs operate on high-frequency, fixed routes, making reliability, charging time, and total cost of ownership crucial for long-term fleet deployment. The market is benefiting from increasing investment in urban electrification, public-private partnerships, and innovative financing models such as battery leasing and fleet-as-a-service. Cities and transit authorities are prioritizing route optimization, energy-efficient charging infrastructure, and lifecycle cost management, making BEBs an essential component of modern, sustainable transportation networks.
| Market Scope | |
|---|---|
| Start Year | 2025 |
| Forecast Year | 2026-2035 |
| Start Value | $43 Billion |
| Forecast Value | $196.8 Billion |
| CAGR | 16.1% |
Battery electric buses are being developed as integrated mobility solutions rather than simple conversions of diesel buses. Key systems such as high-capacity battery packs, electric traction motors, regenerative braking, advanced power electronics, and energy management software are designed together to maximize efficiency, range, and passenger capacity. OEMs and transit operators now focus on operational factors like route compatibility, depot infrastructure, and long-term maintenance costs over upfront pricing. Collaborative approaches among city governments, energy utilities, and charging infrastructure providers are accelerating adoption while reducing project risks. Bundled contracts, battery leasing models, and depot-based charging networks are enabling operators to maintain consistent fleet performance and financial sustainability.
The LFP (Lithium Iron Phosphate) battery segment accounted for 57% share in 2025 and is projected to grow at a CAGR of 16.4% through 2035. LFP batteries are preferred in BEBs for their enhanced thermal stability, safety profile, and long cycle life, making them ideal for high-utilization urban buses. They can endure frequent charging and discharging cycles while minimizing risks of overheating, which is critical in densely populated urban areas. Their cost efficiency and durability further encourage fleet operators to adopt LFP technology as a standard solution for sustainable public transportation.
The buses with 40-70 seats segment held a sizeable share in 2025, representing the standard configuration for urban and suburban public transit networks. This seating range offers the optimal balance between passenger capacity, maneuverability, and route flexibility. Compatibility with existing roads, depots, and charging infrastructure facilitates seamless integration into current transit systems, making this category the most widely adopted among fleet operators. Their ability to serve high-frequency routes efficiently while maintaining operational performance under continuous use drives their market dominance.
China Battery Electric Buses Market will grow at a decent CAGR during 2026-2035. National and local governments are implementing aggressive electrification mandates, large-scale procurement initiatives, and financial incentives such as subsidies, tax benefits, and dedicated funding for zero-emission fleets. Urban centers have already achieved near-full electrification of bus fleets, ensuring a stable and standardized technology deployment environment. Government-led programs support infrastructure expansion, including depot charging and energy management systems, further strengthening adoption. The policy-driven push, combined with domestic manufacturing capabilities, is creating a favorable growth ecosystem for BEBs in the region.
Key players in the Global Battery Electric Buses Market include Volvo, BYD, MAN Bus, Scania, Daimler, Zhongtong Bus, Tata Motors, NFI, Proterra, and Solaris Bus & Coach. Companies in the Global Battery Electric Buses Market are strengthening their presence by investing in R&D to enhance battery efficiency, reduce charging times, and increase vehicle range. Strategic alliances with energy providers, city transit authorities, and technology partners allow manufacturers to offer integrated mobility solutions. Expansion into emerging markets, development of scalable depot-based charging infrastructure, and deployment of fleet-as-a-service and battery leasing models help operators manage capital costs while ensuring operational reliability. OEMs are also standardizing vehicle components, modularizing designs for different fleet sizes, and enhancing after-sales support to maintain performance and build long-term customer relationships, thereby solidifying market foothold and accelerating adoption worldwide.
Table of Contents
Chapter 1 Methodology
- 1.1 Research approach
- 1.2 Quality commitments
- 1.2.1 GMI AI policy & data integrity commitment
- 1.3 Research trail & confidence scoring
- 1.3.1 Research trail components
- 1.3.2 Scoring components
- 1.4 Data collection
- 1.4.1 Partial list of primary sources
- 1.5 Data mining sources
- 1.5.1 Paid sources
- 1.6 Base estimates and calculations
- 1.6.1 Base year calculation
- 1.7 Forecast model
- 1.8 Research transparency addendum
Chapter 2 Executive Summary
- 2.1 Industry 360° synopsis, 2022 - 2035
- 2.2 Key market trends
- 2.2.1 Regional
- 2.2.2 Battery Chemistry
- 2.2.3 Battery Capacity
- 2.2.4 Bus Length
- 2.2.5 Seating Capacity
- 2.2.6 Application
- 2.2.7 End Use
- 2.3 TAM Analysis, 2026-2035
- 2.4 CXO perspectives: Strategic imperatives
Chapter 3 Industry Insights
- 3.1 Industry ecosystem analysis
- 3.1.1 Supplier landscape
- 3.1.2 Profit margin analysis
- 3.1.3 Cost structure
- 3.1.4 Value addition at each stage
- 3.1.5 Factor affecting the value chain
- 3.1.6 Disruptions
- 3.2 Industry impact forces
- 3.2.1 Growth drivers
- 3.2.1.1 Rise in government subsidies and public transport electrification programs
- 3.2.1.2 Surge in urban air pollution and stringent emission regulations
- 3.2.1.3 Increase in battery performance and decline in battery costs
- 3.2.1.4 Rise in fuel prices and operating costs of diesel buses
- 3.2.2 Industry pitfalls and challenges
- 3.2.2.1 High upfront cost of battery electric buses
- 3.2.2.2 Battery degradation and replacement cost concerns
- 3.2.3 Market opportunities
- 3.2.3.1 Increase in adoption of high-capacity battery electric buses
- 3.2.3.2 Surge in participation of private fleet operators
- 3.2.3.3 Rise in battery recycling and second-life applications
- 3.2.3.4 Increase in deployment of smart and connected electric bus solutions
- 3.2.1 Growth drivers
- 3.3 Growth potential analysis
- 3.4 Regulatory landscape
- 3.4.1 North America
- 3.4.1.1 Federal Transit Administration (FTA) Low or No Emission Bus Program
- 3.4.1.2 EPA Clean School Bus Program
- 3.4.1.3 California Advanced Clean Fleets (ACF) Regulation.
- 3.4.2 Europe
- 3.4.2.1 European Union: Clean Vehicles Directive (CVD)
- 3.4.2.2 Germany: Federal Zero-Emission Bus Funding Program
- 3.4.2.3 United Kingdom: Zero-Emission Bus Regional Areas (ZEBRA & ZEBRA 2) Program
- 3.4.2.4 France: Energy Transition for Green Growth Law
- 3.4.3 Asia Pacific
- 3.4.3.1 China: New Energy Bus (NEB) Promotion & Procurement Policies
- 3.4.3.2 Japan: Green Growth Strategy for Decarbonized Public Transport
- 3.4.3.3 South Korea: Eco-Friendly Vehicle Roadmap for Public Transport
- 3.4.3.4 Singapore: Green Public Transport Programme (GPTP)
- 3.4.4 Latin America
- 3.4.4.1 Brazil: Municipal Zero-Emission Bus Procurement Mandates
- 3.4.4.2 Mexico: Clean Transport and Public Fleet Modernization Policies
- 3.4.4.3 Chile: National Electric Mobility Strategy
- 3.4.5 MEA
- 3.4.5.1 United Arab Emirates: National Sustainable Transport & Smart Mobility Policies
- 3.4.5.2 Saudi Arabia: Vision 2030 Public Transport Electrification Framework
- 3.4.5.3 South Africa:Green Transport Strategy
- 3.4.1 North America
- 3.5 Porter’s analysis
- 3.6 PESTEL analysis
- 3.7 Technology and Innovation landscape
- 3.7.1 Current technological trends
- 3.7.2 Emerging technologies
- 3.8 Patent analysis
- 3.9 Sustainability and environmental impact analysis
- 3.9.1 Sustainable practices
- 3.9.2 Waste reduction strategies
- 3.9.3 Energy efficiency in production
- 3.9.4 Eco-friendly initiatives
- 3.9.5 Carbon footprint considerations
- 3.10 Cost breakdown analysis
- 3.11 Sustainability and environmental impact analysis
- 3.11.1 Sustainable practices
- 3.11.2 Waste reduction strategies
- 3.11.3 Energy efficiency in production
- 3.11.4 Eco-friendly initiatives
- 3.11.5 Carbon footprint considerations
- 3.12 Charging Infrastructure & Grid Readiness Assessment
- 3.13 Fleet Transition & Deployment Models
- 3.14 Future outlook & opportunities
Chapter 4 Competitive Landscape, 2025
- 4.1 Introduction
- 4.2 Company market share analysis
- 4.2.1 North America
- 4.2.2 Europe
- 4.2.3 Asia Pacific
- 4.2.4 Latin America
- 4.2.5 MEA
- 4.3 Competitive analysis of major market players
- 4.4 Competitive positioning matrix
- 4.5 Key developments
- 4.5.1 Mergers & acquisitions
- 4.5.2 Partnerships & collaborations
- 4.5.3 New Product Launches
- 4.5.4 Expansion Plans and funding
Chapter 5 Market Estimates & Forecast, By Battery Chemistry, 2022 - 2035 ($Bn, Units)
- 5.1 Key trends
- 5.2 LFP
- 5.3 NCM/NMC
- 5.4 NCA
- 5.5 Others
Chapter 6 Market Estimates & Forecast, By Battery Capacity, 2022 - 2035 ($Bn, Units)
- 6.1 Key trends
- 6.2 Below 100 kWh
- 6.3 100-300 kWh
- 6.4 Above 300 kWh
Chapter 7 Market Estimates & Forecast, By Bus Length, 2022 - 2035 ($Bn, Units)
- 7.1 Key trends
- 7.2 Less than 9 meters
- 7.3 9-14 meters
- 7.4 More than 14 meters
Chapter 8 Market Estimates & Forecast, By Seating Capacity, 2022 - 2035 ($Bn, Units)
- 8.1 Key trends
- 8.2 Below 40 Seats
- 8.3 40-70 Seats
- 8.4 Above 70 Seats
Chapter 9 Market Estimates & Forecast, By Application, 2022 - 2035 ($Bn, Units)
- 9.1 Key trends
- 9.2 Transit & City Buses
- 9.3 School Buses
- 9.4 Coaches
- 9.5 Other
Chapter 10 Market Estimates & Forecast, By End Use, 2022 - 2035 ($Bn, Units)
- 10.1 Key trends
- 10.2 Government & Public Sector
- 10.3 Private Operators
Chapter 11 Market Estimates & Forecast, By Region, 2022 - 2035 ($Bn, Units)
- 11.1 Key trends
- 11.2 North America
- 11.2.1 US
- 11.2.2 Canada
- 11.3 Europe
- 11.3.1 Germany
- 11.3.2 UK
- 11.3.3 France
- 11.3.4 Italy
- 11.3.5 Spain
- 11.3.6 Russia
- 11.3.7 Belgium
- 11.3.8 Netherlands
- 11.3.9 Sweden
- 11.4 Asia Pacific
- 11.4.1 China
- 11.4.2 India
- 11.4.3 Japan
- 11.4.4 Australia
- 11.4.5 South Korea
- 11.4.6 Philippines
- 11.4.7 Indonesia
- 11.4.8 Singapore
- 11.5 Latin America
- 11.5.1 Brazil
- 11.5.2 Mexico
- 11.5.3 Argentina
- 11.6 MEA
- 11.6.1 South Africa
- 11.6.2 Saudi Arabia
- 11.6.3 UAE
Chapter 12 Company Profiles
- 12.1 Global Players
- 12.1.1 Alexander Dennis (ADL)
- 12.1.2 BYD Company
- 12.1.3 Daimler Truck (Mercedes-Benz Buses)
- 12.1.4 Higer Bus Company
- 12.1.5 King Long United Automotive Industry
- 12.1.6 MAN Truck & Bus
- 12.1.7 NFI (New Flyer)
- 12.1.8 Scania
- 12.1.9 VDL Bus & Coach
- 12.1.10 Volvo
- 12.1.11 Yutong
- 12.1.12 Zhongtong Bus
- 12.2 Regional Players
- 12.2.1 Ashok Leyland
- 12.2.2 Blue Bird
- 12.2.3 Ebusco
- 12.2.4 Gillig
- 12.2.5 Irizar e-mobility
- 12.2.6 Lion Electric Company
- 12.2.7 Solaris Bus & Coach
- 12.2.8 Tata Motors
- 12.2.9 Temsa
- 12.3 Emerging Players
- 12.3.1 Ankai Automobile
- 12.3.2 Arrival
- 12.3.3 CRRC Electric Vehicle
- 12.3.4 Foton Motor
- 12.3.5 GreenPower Motor Company.
- 12.3.6 JBM Auto
- 12.3.7 Phoenix Motor
- 12.3.8 Switch Mobility
- 12.3.9 Wrightbus

