
PUBLISHER: Global Market Insights Inc. | PRODUCT CODE: 1998688

PUBLISHER: Global Market Insights Inc. | PRODUCT CODE: 1998688
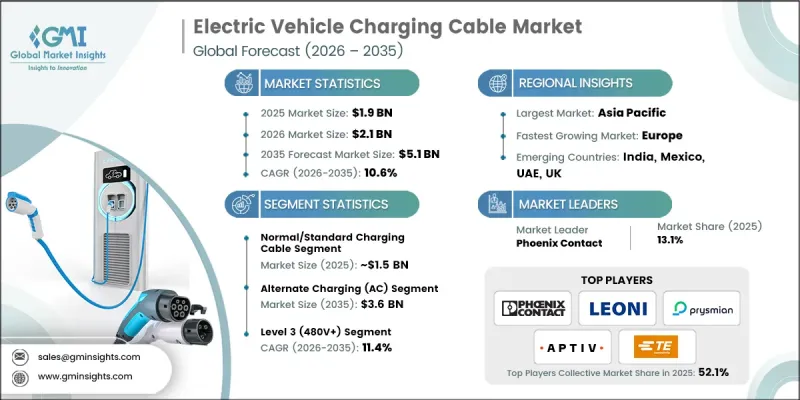
Electric Vehicle Charging Cable Market Opportunity, Growth Drivers, Industry Trend Analysis, and Forecast 2026 - 2035
The Global Electric Vehicle Charging Cable Market was valued at USD 1.9 billion in 2025 and is estimated to grow at a CAGR of 10.6% to reach USD 5.1 billion by 2035.
The rising adoption of electric vehicles worldwide is driving strong demand for reliable and efficient charging infrastructure, with charging cables serving as a critical component of the EV supply equipment (EVSE) ecosystem. These cables link charging stations to vehicles, ensuring safe and efficient energy transfer. Government incentives, stricter emission regulations, and investments in EV infrastructure are supporting market growth, while technological advancements in high-power connectors, multi-vehicle compatibility, and faster charging solutions are further enhancing the adoption of these cables. With both public and private charging networks expanding rapidly, manufacturers are focusing on producing scalable, durable, and versatile charging solutions to accommodate the growing EV population globally.
| Market Scope | |
|---|---|
| Start Year | 2025 |
| Forecast Year | 2026-2035 |
| Start Value | $1.9 Billion |
| Forecast Value | $5.1 Billion |
| CAGR | 10.6% |
The normal or standard charging cable segment held 80.7% share, generating USD 1.5 billion in 2025. Most charging sessions occur at homes or workplaces, which primarily rely on AC charging infrastructure. Standard cables are fully compatible with widely deployed AC wall boxes and public AC chargers, making them the default choice for new EVs and aftermarket purchases. The broader availability of AC chargers compared to DC fast chargers drives the dominance of this segment.
The alternate current (AC) charging segment held 75.6% share in 2025 and is expected to reach USD 3.6 billion by 2035. AC charging remains the preferred choice for most EV owners due to cost-effectiveness, widespread infrastructure compatibility, and suitability for home and workplace use. In many regions, AC charging points significantly outnumber DC fast chargers, particularly in emerging markets, supporting the sustained growth of this segment.
U.S. Electric Vehicle Charging Cable Market reached USD 204.4 million in 2025 and is projected to grow at a CAGR of 8.6% between 2026 and 2035. Expansion of domestic EV charging networks, sustainability initiatives, and federal programs like the NEVI Formula Program, which aim to establish a nationwide public charging infrastructure, are driving cable demand. The increasing deployment of DC fast charging stations along highways is further boosting the requirement for high-power DC cables.
Key players operating in the Global Electric Vehicle Charging Cable Market include Phoenix Contact, TE Connectivity, Aptiv, Huber+Suhner, Sinbon Electronics, Prysmian, BRUGG, LEONI, Dyden, and Coroplast. Key strategies adopted by companies in the Electric Vehicle Charging Cable Market include developing high-performance connectors capable of supporting next-generation fast charging and grid integration. Manufacturers are investing in R&D to produce longer-lasting, weather-resistant, and multi-vehicle compatible cables. Strategic partnerships with EV manufacturers and charging station operators allow companies to expand distribution networks and enhance adoption. Emphasis on cost optimization, scalable production, and compliance with international safety standards helps firms maintain market leadership. Companies also focus on technological innovation, including smart monitoring and adaptive power management features, to differentiate their products in a rapidly evolving market.
Table of Contents
Chapter 1 Methodology
- 1.1 Research approach
- 1.2 Quality commitments
- 1.2.1 GMI AI policy & data integrity commitment
- 1.3 Research trail & confidence scoring
- 1.3.1 Research trail components
- 1.3.2 Scoring components
- 1.4 Data collection
- 1.4.1 Partial list of primary sources
- 1.5 Data mining sources
- 1.5.1 Paid sources
- 1.6 Base estimates and calculations
- 1.6.1 Base year calculation
- 1.7 Forecast model
- 1.8 Research transparency addendum
Chapter 2 Executive Summary
- 2.1 Industry 360° synopsis
- 2.2 Key market trends
- 2.2.1 Regional
- 2.2.2 Cable
- 2.2.3 Power Supply
- 2.2.4 Charging Level
- 2.2.5 Connector
- 2.2.6 Mode
- 2.2.7 Diameter
- 2.2.8 Shape
- 2.2.9 Length
- 2.2.10 Application
- 2.2.11 Sales Channel
- 2.3 TAM analysis, 2026-2035
- 2.4 CXO perspectives: Strategic imperatives
Chapter 3 Industry Insights
- 3.1 Industry ecosystem analysis
- 3.1.1 Supplier landscape
- 3.1.2 Profit margin
- 3.1.3 Cost structure
- 3.1.4 Value addition at each stage
- 3.1.5 Factor affecting the value chain
- 3.1.6 Disruptions
- 3.2 Industry impact forces
- 3.2.1 Growth drivers
- 3.2.1.1 Rapid global EV adoption & electrification mandates
- 3.2.1.2 Government incentives & charging infrastructure investments
- 3.2.1.3 Technological advancements in fast charging & liquid cooling
- 3.2.1.4 Growing consumer demand for convenient charging solutions
- 3.2.2 Industry pitfalls and challenges
- 3.2.2.1 Thermal management & heat dissipation challenges
- 3.2.2.2 Lack of universal connector standardization
- 3.2.3 Market opportunities
- 3.2.3.1 Expansion of ultra-fast charging networks (350kW+)
- 3.2.3.2 Emerging markets with low EV penetration rates
- 3.2.3.3 Development of lightweight & sustainable cable materials
- 3.2.1 Growth drivers
- 3.3 Growth potential analysis
- 3.4 Regulatory landscape
- 3.4.1 North America
- 3.4.1.1 National Electrical Code (NEC - NFPA 70)
- 3.4.1.2 UL Solutions
- 3.4.1.3 CSA Group
- 3.4.1.4 SAE International
- 3.4.2 Europe
- 3.4.2.1 European Committee for Electrotechnical Standardization (CENELEC)
- 3.4.2.2 International Electrotechnical Commission (IEC)
- 3.4.2.3 TUV Rheinland
- 3.4.2.4 DIN
- 3.4.3 Asia Pacific
- 3.4.3.1 State Administration for Market Regulation (China)
- 3.4.3.2 Standardization Administration of China (SAC)
- 3.4.3.3 Bureau of Indian Standards (BIS)
- 3.4.3.4 Japanese Industrial Standards Committee (JISC)
- 3.4.4 Latin America
- 3.4.4.1 Instituto Nacional de Metrologia Qualidade e Tecnologia (INMETRO)
- 3.4.4.2 Asociacion de Normalizacion y Certificacion (ANCE)
- 3.4.4.3 Instituto Argentino de Normalizacion y Certificacion (IRAM)
- 3.4.5 Middle East & Africa
- 3.4.5.1 Saudi Standards Metrology and Quality Organization (SASO)
- 3.4.5.2 Emirates Authority for Standardization and Metrology (ESMA)
- 3.4.5.3 South African Bureau of Standards (SABS)
- 3.4.1 North America
- 3.5 Investment & Funding Analysis
- 3.6 Porter's analysis
- 3.7 PESTEL analysis
- 3.8 Technology and innovation landscape
- 3.8.1 Current technologies
- 3.8.1.1 AC charging cables (Mode 2 & Mode 3)
- 3.8.1.2 DC fast charging (50kW-250kW)
- 3.8.1.3 Smart charging & load management systems
- 3.8.1.4 Standardized connector technologies (CCS, CHAdeMO, GB/T)
- 3.8.2 Emerging technologies
- 3.8.2.1 Ultra-fast charging cables (350 kW+)
- 3.8.2.2 Lightweight and flexible cable materials
- 3.8.2.3 Liquid-cooled charging cables
- 3.8.1 Current technologies
- 3.9 Pricing analysis (Driven by Primary Research)
- 3.9.1 Historical Price Trend Analysis
- 3.9.2 Pricing Strategy by Player Type (Premium / Value / Cost-plus)
- 3.10 Patent landscape (Driven by Primary Research)
- 3.11 Trade Data Analysis (Driven by Paid Database)
- 3.11.1 Import/Export Volume & Value Trends
- 3.11.2 Key Trade Corridors & Tariff Impact
- 3.12 Capacity & Production Landscape (Driven by Primary Research)
- 3.12.1 Installed Capacity by Region & Key Producer
- 3.12.2 Capacity Utilization Rates & Expansion Pipelines
- 3.13 Impact of AI & Generative AI on the Market
- 3.13.1 AI-driven disruption of existing business models
- 3.13.2 GenAI use cases & adoption roadmap by segment
- 3.13.3 Risks, limitations & regulatory considerations
- 3.14 EV OEM strategy alignment
- 3.15 Replacement cycle analysis
- 3.15.1 Average lifecycle of EV charging cables
- 3.15.2 Influence of usage patterns & environmental factors
- 3.15.3 Replacement cost & economic considerations
- 3.15.4 Impact of technological upgrades on replacement cycles
- 3.16 Case studies
- 3.17 Forecast assumptions & scenario analysis (Driven by Primary Research)
- 3.17.1 Base Case - key macro & industry variables driving CAGR
- 3.17.2 Optimistic Scenarios - Favorable macro and industry tailwinds
- 3.17.3 Pessimistic Scenario - Macroeconomic slowdown or industry headwinds
Chapter 4 Competitive Landscape, 2025
- 4.1 Introduction
- 4.2 Company market share analysis
- 4.2.1 North America
- 4.2.2 Europe
- 4.2.3 Asia Pacific
- 4.2.4 LATAM
- 4.2.5 MEA
- 4.3 Competitive analysis of major market players
- 4.4 Competitive positioning matrix
- 4.5 Key developments
- 4.5.1 Mergers & acquisitions
- 4.5.2 Partnerships & collaborations
- 4.5.3 New product launches
- 4.5.4 Expansion plans and funding
- 4.6 Company tier benchmarking
- 4.6.1 Tier classification criteria & qualifying thresholds
- 4.6.2 Tier positioning matrix by revenue, geography & innovation
Chapter 5 Market Estimates & Forecast, By Cable, 2022 - 2035 ($Mn, Thousand Units)
- 5.1 Key trends
- 5.2 Normal/Standard Charging Cable
- 5.3 High-Power Charging (HPC) Cable
- 5.3.1 Standard/Uncooled High-Power Charging (HPC) Cable
- 5.3.2 Liquid-Cooled High-Power Charging Cable
Chapter 6 Market Estimates & Forecast, By Power Supply, 2022 - 2035 ($Mn, Thousand Units)
- 6.1 Key trends
- 6.2 Alternate Charging (AC)
- 6.3 Direct Charging (DC)
Chapter 7 Market Estimates & Forecast, By Charging Level, 2022 - 2035 ($Mn, Thousand Units)
- 7.1 Key trends
- 7.2 Level 1 (120V)
- 7.3 Level 2 (240V)
- 7.4 Level 3 (480V+)
Chapter 8 Market Estimates & Forecast, By Connector, 2022 - 2035 ($Mn, Thousand Units)
- 8.1 Key trends
- 8.2 Type 1
- 8.3 Type 2
- 8.4 CCS 1
- 8.5 CCS 2
- 8.6 CHAdeMO
- 8.7 GB/T
- 8.8 NACS/Tesla
Chapter 9 Market Estimates & Forecast, By Mode, 2022 - 2035 ($Mn, Thousand Units)
- 9.1 Key trends
- 9.2 Mode 1 & 2
- 9.3 Mode 3
- 9.4 Mode 4
Chapter 10 Market Estimates & Forecast, By Diameter, 2022 - 2035 ($Mn, Thousand Units)
- 10.1 Key trends
- 10.2 10 mm
- 10.3 10-20 mm
- 10.4 Above 20 mm
Chapter 11 Market Estimates & Forecast, By Shape, 2022 - 2035 ($Mn, Thousand Units)
- 11.1 Key trends
- 11.2 Straight
- 11.3 Coiled
Chapter 12 Market Estimates & Forecast, By Length, 2022 - 2035 ($Mn, Thousand Units)
- 12.1 Key trends
- 12.2 Below 5 meters
- 12.3 5-10 meters
- 12.4 Above 10 meters
Chapter 13 Market Estimates & Forecast, By Application, 2022 - 2035 ($Mn, Thousand Units)
- 13.1 Key trends
- 13.2 Private Charging
- 13.3 Public Charging
- 13.3.1 Shopping malls
- 13.3.2 Airports
- 13.3.3 Highways
- 13.3.4 Commercial Parking
- 13.3.5 Others
Chapter 14 Market Estimates & Forecast, By Sales Channel, 2022 - 2035 ($Mn, Thousand Units)
- 14.1 Key trends
- 14.2 OEM
- 14.3 Aftermarket
Chapter 15 Market Estimates & Forecast, By Region, 2022 - 2035 ($Mn, Thousand Units)
- 15.1 Key trends
- 15.2 North America
- 15.2.1 US
- 15.2.2 Canada
- 15.3 Europe
- 15.3.1 Germany
- 15.3.2 UK
- 15.3.3 France
- 15.3.4 Italy
- 15.3.5 Spain
- 15.3.6 Belgium
- 15.3.7 Russia
- 15.3.8 Netherlands
- 15.4 Asia Pacific
- 15.4.1 China
- 15.4.2 India
- 15.4.3 Japan
- 15.4.4 South Korea
- 15.4.5 Australia
- 15.4.6 Singapore
- 15.4.7 Malaysia
- 15.4.8 Vietnam
- 15.4.9 Thailand
- 15.5 Latin America
- 15.5.1 Brazil
- 15.5.2 Mexico
- 15.5.3 Argentina
- 15.5.4 Colombia
- 15.6 MEA
- 15.6.1 South Africa
- 15.6.2 Saudi Arabia
- 15.6.3 UAE
Chapter 16 Company Profiles
- 16.1 Global players
- 16.1.1 Phoenix Contact
- 16.1.2 TE Connectivity
- 16.1.3 LEONI
- 16.1.4 Prysmian
- 16.1.5 Aptiv
- 16.1.6 Huber+Suhner
- 16.1.7 Dyden
- 16.1.8 Coroplast
- 16.1.9 BRUGG
- 16.1.10 Tesla
- 16.2 Regional players
- 16.2.1 Chengdu Khons
- 16.2.2 Sinbon Electronics
- 16.2.3 EV TEISON
- 16.2.4 Guchen Electronics
- 16.2.5 Manlon
- 16.2.6 Pod Point
- 16.3 Emerging players
- 16.3.1 Juice Technology
- 16.3.2 Webasto
- 16.3.3 Masterplug
- 16.3.4 Zencar

