
PUBLISHER: Global Market Insights Inc. | PRODUCT CODE: 2038442

PUBLISHER: Global Market Insights Inc. | PRODUCT CODE: 2038442
Asia Pacific Water Treatment Equipment Market Opportunity, Growth Drivers, Industry Trend Analysis, and Forecast 2026 - 2035
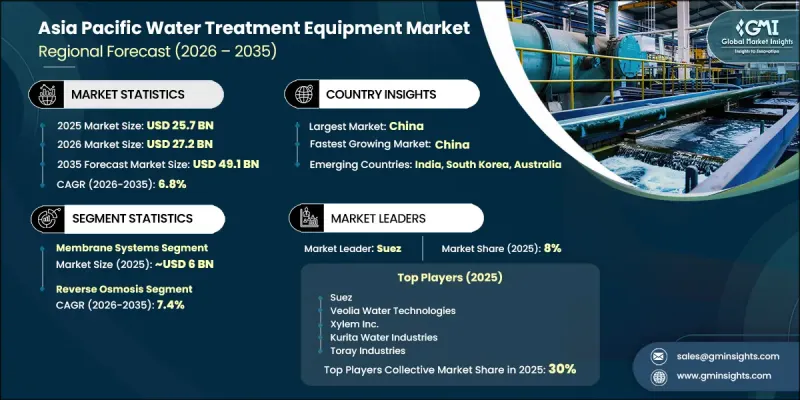
Asia Pacific Water Treatment Equipment Market was valued at USD 25.7 billion in 2025 and is estimated to grow at a CAGR of 6.8% to reach USD 49.1 billion by 2035.
Market expansion is influenced by the increasing need for reliable access to clean water and effective wastewater management across the region. Rising industrialization and urban population growth are placing significant pressure on existing water resources, prompting greater adoption of advanced treatment systems. Both municipal and industrial sectors are increasingly required to comply with stricter water quality standards, which accelerate investment in modern purification technologies. Water treatment equipment plays a crucial role in eliminating contaminants and ensuring safe and sustainable water supply across applications. Manufacturing industries are also increasingly dependent on such systems to support production processes and maintain regulatory compliance. In addition, growing environmental awareness and tightening discharge regulations are encouraging upgrades in water treatment infrastructure. The continuous expansion of water-intensive industries, combined with the need for efficient reuse and recycling of water, is further supporting market growth across Asia Pacific.
| Market Scope | |
|---|---|
| Start Year | 2025 |
| Forecast Year | 2026-2035 |
| Start Value | $25.7 Billion |
| Forecast Value | $49.1 Billion |
| CAGR | 6.8% |
The membrane systems segment generated USD 6 billion in 2025 and is expected to grow at a CAGR of 7.2% from 2026 to 2035. This segment holds a significant share of the market due to its high efficiency in removing contaminants and its adaptability across multiple treatment applications. Membrane-based solutions deliver consistent water quality while requiring a relatively compact installation footprint compared to conventional systems. The segment includes technologies such as reverse osmosis, ultrafiltration, microfiltration, and nanofiltration, each addressing specific purification requirements. These systems are widely applied in desalination processes as well as wastewater recovery and reuse applications across industrial and municipal sectors.
The reverse osmosis segment accounted for 27.7% share in 2025 and is projected to grow at a CAGR of 7.4% from 2026 to 2035. This technology leads the market due to its strong ability to eliminate dissolved salts, impurities, and microorganisms from water sources. It is extensively used in industries that require high-purity water, including energy generation, pharmaceuticals, and electronics manufacturing. Municipal utilities also rely on reverse osmosis systems for desalination and safe drinking water production. The rising demand for high-quality water across both industrial and public infrastructure continues to strengthen the adoption of this technology.
China Water Treatment Equipment Market reached USD 8.6 billion in 2025 and is expected to grow at a CAGR of 7.5% from 2026 to 2035. Market growth in China is supported by its large industrial base, rapid urban expansion, and strong government focus on environmental protection initiatives. Industrial sectors across the country depend heavily on water treatment systems for production processes and wastewater handling. Expanding municipal infrastructure is also driving large-scale investments in modern treatment facilities. Increasing regulatory pressure on water quality standards is further encouraging the adoption of advanced purification technologies across industries.
Key companies operating in the Asia Pacific Water Treatment Equipment Market include Veolia Water Technologies, Xylem Inc., Kurita Water Industries, Thermax, Suez, VA Tech Wabag, Hitachi (Aqua-Tech), Doosan Enerbility, Ebara Corporation, Ion Exchange India, LG Chem (LG Water Solutions), Nitto Denko (Hydranautics), Organo Corporation, Sembcorp Industries, and Toray Industries. Companies in the Asia Pacific Water Treatment Equipment Market are focusing on technological innovation, capacity expansion, and strategic collaborations to strengthen their market position. Significant investments are being made in research and development to enhance filtration efficiency, reduce energy consumption, and improve system durability. Market participants are increasingly forming partnerships with municipal authorities and industrial users to expand project deployments and strengthen long-term contracts. Digital monitoring and automation technologies are being integrated to improve system performance and enable real-time water quality tracking. Firms are also expanding manufacturing capabilities across emerging economies to reduce production costs and improve supply chain efficiency.
Table of Contents
Chapter 1 Methodology and Scope
- 1.1 Market scope and definition
- 1.2 Research design
- 1.2.1 Research approach
- 1.2.2 Data collection methods
- 1.3 Data mining sources
- 1.3.1 Country
- 1.4 Base estimates and calculations
- 1.4.1 Base year calculation
- 1.4.2 Key trends for market estimation
- 1.5 Primary research and validation
- 1.5.1 Primary sources
- 1.6 Forecast model
- 1.7 Research assumptions and limitations
Chapter 2 Executive Summary
- 2.1 Industry 360° synopsis
- 2.2 Key market trends
- 2.2.1 Product Type
- 2.2.2 Technology
- 2.2.3 End User
- 2.2.4 Distribution Channel
Chapter 3 Industry Insights
- 3.1 Industry ecosystem analysis
- 3.1.1 Supplier landscape
- 3.1.2 Profit margin
- 3.1.3 Value addition at each stage
- 3.1.4 Factor affecting the value chain
- 3.2 Industry impact forces
- 3.2.1 Growth drivers
- 3.2.2 Industry pitfalls & challenges
- 3.2.3 Opportunities
- 3.3 Growth potential analysis
- 3.4 Future market trends
- 3.5 Technology and innovation landscape
- 3.5.1 Current technological trends
- 3.5.2 Emerging technologies
- 3.6 Pricing Analysis (Driven by Primary Research)
- 3.6.1 Historical Price Trend Analysis (2020-2025) (Driven by Primary Research)
- 3.6.2 Pricing Strategy by Player Type (Premium/Value/Cost-Plus) (Driven by Primary Research)
- 3.7 Regulatory landscape
- 3.7.1 Standards and compliance requirements
- 3.7.2 Regional regulatory frameworks
- 3.7.3 Certification standards
- 3.8 Porter's analysis
- 3.9 PESTEL analysis
- 3.10 Trade Data Analysis
- 3.10.1 Import/Export Volume & Value Trends (2020-2025) (Driven by Primary Research)
- 3.10.2 Key Trade Corridors & Tariff Impact (Driven by Primary Research)
- 3.11 Impact of AI & Generative AI on the Market
- 3.11.1 AI-Driven disruption of existing business models
- 3.11.2 GenAI use cases & adoption roadmap by segment
- 3.11.3 Risks, limitations & regulatory considerations
- 3.12 Capacity & Production Landscape (Driven by Primary Research)
- 3.12.1 Installed capacity by country & key producer (Driven by Primary Research)
- 3.12.2 Capacity utilization rates & expansion pipelines (Driven by Primary Research)
Chapter 4 Competitive Landscape, 2025
- 4.1 Introduction
- 4.2 Company market share analysis
- 4.2.1 By Country
- 4.2.1.1 China
- 4.2.1.2 Japan
- 4.2.1.3 India
- 4.2.1.4 Australia
- 4.2.1.5 South Korea
- 4.2.1 By Country
- 4.3 Company matrix analysis
- 4.4 Competitive analysis of major market players
- 4.5 Competitive positioning matrix
- 4.6 Key developments
- 4.6.1 Mergers & acquisitions
- 4.6.2 Partnerships & collaborations
- 4.6.3 New product launches
- 4.6.4 Expansion plans
Chapter 5 Market Estimates & Forecast, By Product type, 2022 - 2035, (USD Billion) (Thousand Units)
- 5.1 Key trends
- 5.2 Sedimentation tanks
- 5.3 Filtration systems
- 5.4 Disinfection equipment
- 5.5 Softening equipment
- 5.6 Membrane systems
- 5.7 Others
Chapter 6 Market Estimates & Forecast, By Technology, 2022 - 2035, (USD Billion) (Thousand Units)
- 6.1 Key trends
- 6.2 Reverse osmosis
- 6.3 Microfiltration
- 6.4 Clarifier
- 6.5 Distillation
- 6.6 Ion exchange
- 6.7 Others
Chapter 7 Market Estimates & Forecast, By End User, 2022 - 2035, (USD Billion) (Thousand Units)
- 7.1 Key trends
- 7.2 Residential
- 7.3 Agriculture
- 7.4 Chemical manufacturing
- 7.5 Food processing
- 7.6 Construction
- 7.7 Pharmaceutical production
- 7.8 Others
Chapter 8 Market Estimates & Forecast, By Distribution Channel, 2022 - 2035, (USD Billion) (Thousand Units)
- 8.1 Key trends
- 8.2 Direct
- 8.3 Indirect
Chapter 9 Market Estimates and Forecast, By Country, 2022 - 2035 (USD Billion) (Thousand Units)
- 9.1 Key trends
- 9.2 China
- 9.3 Japan
- 9.4 India
- 9.5 Australia
- 9.6 South Korea
Chapter 10 Company Profiles
- 10.1 Doosan Enerbility
- 10.2 Ebara Corporation
- 10.3 Hitachi (Aqua-Tech)
- 10.4 Ion Exchange India
- 10.5 Kurita Water Industries
- 10.6 LG Chem (LG Water Solutions)
- 10.7 Nitto Denko (Hydranautics)
- 10.8 Organo Corporation
- 10.9 Sembcorp Industries
- 10.10 Suez
- 10.11 Thermax
- 10.12 Toray Industries
- 10.13 VA Tech Wabag
- 10.14 Veolia Water Technologies
- 10.15 Xylem Inc.

