PUBLISHER: Global Market Insights Inc. | PRODUCT CODE: 2045725

PUBLISHER: Global Market Insights Inc. | PRODUCT CODE: 2045725
Combined Cycle Gas Turbine Market Opportunity, Growth Drivers, Industry Trend Analysis, and Forecast 2026 - 2035
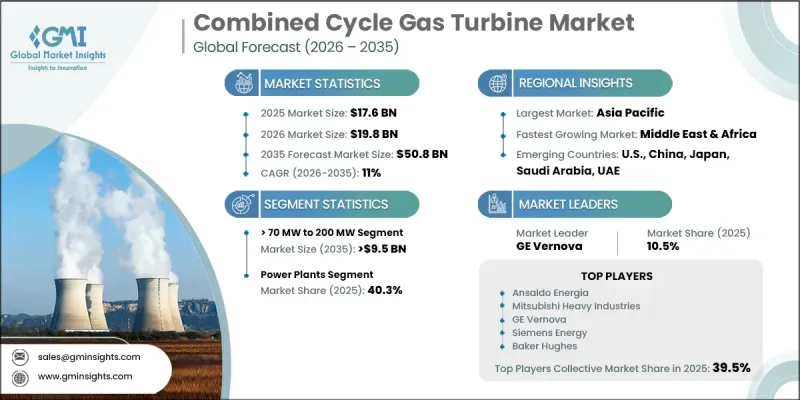
The Global Combined Cycle Gas Turbine Market was valued at USD 17.6 billion in 2025 and is estimated to grow at a CAGR of 11% to reach USD 50.8 billion by 2035.
The market growth is supported by the global shift toward cleaner and more efficient power generation systems. Increasing concerns over carbon emissions, air pollution, and climate change are pushing utilities and governments to adopt advanced low-emission technologies. Investments in renewable integration, grid modernization, and high-efficiency energy systems are further strengthening market expansion. Combined cycle gas turbine systems are increasingly preferred due to their ability to deliver high power output with improved fuel efficiency and reduced environmental impact. These systems are widely recognized for converting natural gas into electricity through a dual-stage process that captures waste heat to generate additional power, significantly improving overall efficiency compared to traditional thermal systems. As global energy demand rises, the technology is gaining traction as a reliable bridge between conventional and renewable energy sources, supporting grid stability and flexible power supply requirements across regions.
| Market Scope | |
|---|---|
| Start Year | 2025 |
| Forecast Year | 2026-2035 |
| Start Value | $17.6 Billion |
| Forecast Value | $50.8 Billion |
| CAGR | 11% |
The > 70 MW to 200 MW segment is projected to reach USD 9.5 billion by 2035. This segment benefits from its strong suitability for rapid load response and fast operational start-up, making it highly effective for managing peak electricity demand and maintaining grid stability. Its adoption is expanding across large-scale utility projects, offshore energy facilities, maritime operations, and aviation-related applications, where reliable and efficient power output is essential. The increasing deployment of these medium-to-large capacity systems across diverse energy-intensive sectors continues to accelerate segment growth.
The power generation application segment accounted for a 40.3% share in 2025. Growth in this segment is being driven by rising global electricity consumption, the transition toward low-carbon energy systems, and the phased retirement of aging coal-based power infrastructure. Compared to conventional thermal plants, combined cycle gas turbine facilities offer higher efficiency, lower emissions, faster ramp-up capabilities, and improved fuel flexibility. The rising need for flexible gas-based generation to support peak demand and stabilize grids is further amplified by the growing penetration of intermittent renewable energy sources.
U.S. Combined Cycle Gas Turbine Market held a 72% share in 2025, generating USD 2.5 billion. Market expansion is supported by strong demand for reliable electricity generation and the widespread availability of affordable natural gas. Combined cycle gas turbine systems are increasingly deployed to balance fluctuations from renewable energy sources such as wind and solar, due to their operational flexibility and high efficiency. Strong regulatory focus on emission reduction, energy security priorities, and continued modernization of power infrastructure are further reinforcing market growth in the country.
Major players operating in the Global Combined Cycle Gas Turbine Industry include GE Vernova, Siemens Energy, Mitsubishi Heavy Industries, Baker Hughes, Ansaldo Energia, Kawasaki Heavy Industries, Doosan Enerbility, Bharat Heavy Electricals Limited (BHEL), Rolls Royce, Shanghai Electric, Capstone Green Energy Holdings, Harbin Electric Corporation, Solar Turbines Incorporated, Wartsila, Ethos Energy Group, Everllence, MAPNA Group, Flex Energy Solutions, VERICOR, and Zorya-Mashproekt. Companies in the combined cycle gas turbine market are focusing on advancing turbine efficiency through next-generation design improvements that maximize output while minimizing fuel consumption. Many players are strengthening their position by investing heavily in digitalization, predictive maintenance, and real-time monitoring systems to enhance operational reliability. Strategic partnerships with utilities and independent power producers are being used to secure long-term service agreements and project pipelines. Manufacturers are also expanding R&D efforts to support hydrogen-ready and low-carbon turbine solutions aligned with global decarbonization goals. Cost optimization strategies, including modular plant designs and standardized components, are helping reduce installation and maintenance expenses.
Table of Contents
Chapter 1 Methodology & Scope
- 1.1 Research approach
- 1.2 Quality commitments
- 1.2.1 GMI AI policy & data integrity commitment
- 1.2.1.1 Source consistency protocol
- 1.2.1 GMI AI policy & data integrity commitment
- 1.3 Research trail & confidence scoring
- 1.3.1 Research trail components
- 1.3.2 Scoring components
- 1.4 Data collection
- 1.4.1 Partial list of primary sources
- 1.5 Data mining sources
- 1.5.1 Paid sources
- 1.5.1.1 Sources, by region
- 1.5.1 Paid sources
- 1.6 Base estimates and calculations
- 1.6.1 Base year calculation for any one approach
- 1.7 Market estimates & forecasts parameters
- 1.8 Forecast model
- 1.8.1 Quantified market impact analysis
- 1.8.1.1 Mathematical impact of growth parameters on forecast
- 1.8.1 Quantified market impact analysis
- 1.9 Research transparency addendum
- 1.9.1 Source attribution framework
- 1.9.2 Quality assurance metrics
- 1.9.3 Our commitment to trust
- 1.10 Market definitions
Chapter 2 Executive Summary
- 2.1 Industry synopsis, 2022 - 2035
- 2.1.1 Business trends
- 2.1.2 Capacity trends
- 2.1.3 Application trends
- 2.1.4 Regional trends
Chapter 3 Industry Insights
- 3.1 Industry ecosystem analysis
- 3.1.1 Raw material availability & sourcing analysis
- 3.1.2 Manufacturing capacity assessment
- 3.1.3 Supply chain resilience & risk factors
- 3.1.4 Distribution network analysis
- 3.2 Industry impact forces
- 3.2.1 Growth drivers
- 3.2.2 Industry pitfalls & challenges
- 3.3 Regulatory landscape
- 3.4 Growth potential analysis
- 3.5 Porter's analysis
- 3.5.1 Bargaining power of suppliers
- 3.5.2 Bargaining power of buyers
- 3.5.3 Threat of new entrants
- 3.5.4 Threat of substitutes
- 3.6 PESTEL analysis
- 3.6.1 Political factors
- 3.6.2 Economic factors
- 3.6.3 Social factors
- 3.6.4 Technological factors
- 3.6.5 Legal factors
- 3.6.6 Environmental factors
- 3.7 Cost structure analysis of combined cycle gas turbines
- 3.8 Growth in untapped markets & applications
- 3.9 Digitalization & IoT integration
- 3.10 Investment analysis & future prospects
- 3.11 Price trend analysis (USD/Unit) (Driven by Primary Research)
- 3.11.1 By region (Driven by Primary Research)
- 3.11.2 By capacity (Driven by Primary Research)
- 3.12 Trade data analysis (Driven by Primary Research)
- 3.12.1 Import/export value trends (Driven by Primary Research)
- 3.12.2 Key trade corridors & tariff impact (Driven by Primary Research)
- 3.13 Capacity & production landscape (Driven by Primary Research)
- 3.13.1 Capacity by region & key producer (Driven by Primary Research)
- 3.13.2 Capacity utilization rates & expansion pipelines (Driven by Primary Research)
- 3.14 Impact of AI & Generative AI on the market (Driven by Primary Research)
- 3.14.1 AI-Driven production optimization (Driven by Primary Research)
- 3.14.2 Predictive maintenance & fault detection (Driven by Primary Research)
Chapter 4 Competitive Landscape, 2026
- 4.1 Introduction
- 4.2 Company market share analysis, by region, 2025
- 4.2.1 North America
- 4.2.2 Europe
- 4.2.3 Asia Pacific
- 4.2.4 Middle East & Africa
- 4.2.5 Latin America
- 4.3 Competitive analysis of major market players
- 4.4 Competitive positioning matrix
- 4.5 Key developments
- 4.5.1 Mergers & acquisitions
- 4.5.2 Partnerships & collaborations
- 4.5.3 New product launches
- 4.5.4 Expansion plans & funding
- 4.6 Company tier benchmarking
- 4.6.1 Tier classification criteria & qualifying thresholds
- 4.6.2 Tier positioning matrix by revenue, geography & innovation
Chapter 5 Market Size and Forecast, By Capacity, 2022 - 2035 (USD Million & MW)
- 5.1 Key trends
- 5.2 ≤ 50 kW
- 5.3 > 50 kW to 500 kW
- 5.4 > 500 kW to 1 MW
- 5.5 > 1 MW to 30 MW
- 5.6 > 30 MW to 70 MW
- 5.7 > 70 MW to 200 MW
- 5.8 > 200 MW
Chapter 6 Market Size and Forecast, By Application, 2022 - 2035 (USD Million & MW)
- 6.1 Key trends
- 6.2 Power plants
- 6.3 Oil & gas
- 6.4 Process plants
- 6.5 Aviation
- 6.6 Marine
- 6.7 Others
Chapter 7 Market Size and Forecast, By Region, 2022 - 2035 (USD Million & MW)
- 7.1 Key trends
- 7.2 North America
- 7.2.1 U.S.
- 7.2.2 Canada
- 7.3 Mexico
- 7.4 Europe
- 7.4.1 UK
- 7.4.2 France
- 7.4.3 Germany
- 7.4.4 Russia
- 7.4.5 Italy
- 7.4.6 Netherlands
- 7.4.7 Finland
- 7.4.8 Denmark
- 7.4.9 Poland
- 7.4.10 Sweden
- 7.5 Asia Pacific
- 7.5.1 China
- 7.5.2 Australia
- 7.5.3 Japan
- 7.5.4 South Korea
- 7.5.5 Indonesia
- 7.5.6 Thailand
- 7.5.7 Malaysia
- 7.6 Middle East & Africa
- 7.6.1 Saudi Arabia
- 7.6.2 UAE
- 7.6.3 Qatar
- 7.6.4 Kuwait
- 7.6.5 Oman
- 7.6.6 Egypt
- 7.6.7 Turkey
- 7.6.8 Bahrain
- 7.6.9 Iraq
- 7.6.10 South Africa
- 7.6.11 Nigeria
- 7.6.12 Algeria
- 7.7 Latin America
- 7.7.1 Brazil
- 7.7.2 Argentina
- 7.7.3 Chile
Chapter 8 Company Profiles
- 8.1 Ansaldo Energia
- 8.2 Baker Hughes
- 8.3 Bharat Heavy Electricals Limited (BHEL)
- 8.4 Capstone Green Energy Holdings
- 8.5 Doosan Enerbility
- 8.6 Ethos Energy Group
- 8.7 Everllence
- 8.8 Flex Energy Solutions
- 8.9 GE Vernova
- 8.10 Harbin Electric Corporation
- 8.11 Kawasaki Heavy Industries
- 8.12 MAPNA Group
- 8.13 Mitsubishi Heavy Industries
- 8.14 Rolls Royce
- 8.15 Shanghai Electric
- 8.16 Siemens Energy
- 8.17 Solar Turbines Incorporated
- 8.18 VERICOR
- 8.19 Wartsila
- 8.20 Zorya-Mashproekt

