
PUBLISHER: Global Market Insights Inc. | PRODUCT CODE: 2061494

PUBLISHER: Global Market Insights Inc. | PRODUCT CODE: 2061494
Solar Tracker Market Opportunity, Growth Drivers, Industry Trend Analysis, and Forecast 2026 - 2035
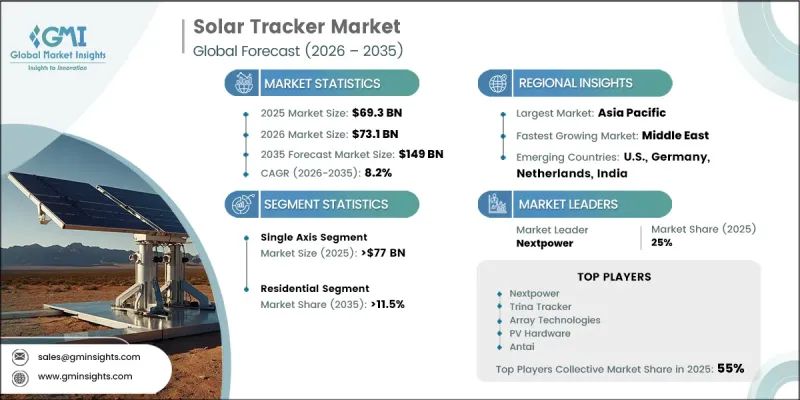
The Global Solar Tracker Market was valued at USD 69.3 billion in 2025 and is estimated to grow at a CAGR of 8.2% to reach USD 149 billion by 2035.
Solar trackers are advanced systems designed to position solar panels or reflective surfaces toward the sun throughout the day to maximize solar energy generation. These systems play a crucial role in improving the efficiency and productivity of solar power installations by maintaining optimal solar exposure. Rising global investments in renewable energy infrastructure and increasing focus on improving solar power generation efficiency are significantly driving market expansion. The growing adoption of utility-scale solar projects and the declining cost of solar tracking technologies are further strengthening industry growth. Solar trackers can substantially improve electricity generation compared to fixed-tilt solar systems, making them increasingly attractive for large-scale and commercial renewable energy projects. Advancements in smart grid integration, Internet of Things technologies, and automated monitoring systems are also enhancing the operational performance and reliability of modern solar trackers. In addition, rising sustainability initiatives and carbon reduction targets established by governments and organizations worldwide are accelerating demand for high-efficiency solar energy technologies, supporting long-term market growth.
| Market Scope | |
|---|---|
| Start Year | 2025 |
| Forecast Year | 2026-2035 |
| Start Value | $69.3 Billion |
| Forecast Value | $149 Billion |
| CAGR | 8.2% |
The solar tracker market is also benefiting from continuous innovation in material technologies and control systems designed to improve durability, operational efficiency, and long-term reliability. Increasing emphasis on reducing maintenance costs and improving energy optimization capabilities is encouraging broader adoption of advanced solar tracking systems across residential, commercial, and utility-scale applications. Expanding renewable energy deployment and growing demand for intelligent energy management solutions are further contributing to positive market dynamics worldwide.
The single-axis segment is expected to reach USD 77 billion by 2035. Single-axis solar trackers continue to witness strong adoption due to their ability to significantly improve solar panel efficiency and energy output compared to fixed-tilt installations. These systems offer enhanced operational reliability, improved durability, and lower maintenance requirements because of advancements in design and engineering technologies. Increasing demand for cost-effective solar optimization solutions and stronger return on investment for solar energy projects are further supporting the widespread deployment of single-axis tracking technologies across the global renewable energy sector.
The residential segment is projected to grow at a CAGR of 11.5% through 2035. Growing interest in residential solar energy adoption, combined with innovative financing models and flexible leasing options, is encouraging homeowners to invest in advanced solar tracking technologies. Community-based solar initiatives and shared renewable energy programs are also contributing to increased deployment of residential solar tracker systems. In addition, integration of solar trackers with smart home technologies is enabling homeowners to improve energy management, monitor system performance, and optimize electricity consumption more effectively.
U.S. Solar Tracker Market is anticipated to reach USD 7.5 billion by 2035. Market growth across the United States is being supported by favorable renewable energy policies, increasing solar energy investments, and expanding deployment of utility-scale solar projects. Strong solar generation potential and continuous technological advancements in solar tracking systems are further contributing to market expansion throughout the region. The growing availability of cost-efficient and user-friendly tracking technologies for residential and commercial applications is also strengthening demand across the U.S. renewable energy industry.
Major companies operating in the Solar Tracker Market include ArcelorMittal, Array Technologies, Arctech, All Earth Renewables, Convert Italia, Degerenergie GmbH, GameChange Solar, Gonvarri Solar Steel, Haosolar, Ideematec, Mecasolar, Nclave, Nextpower, Powerway Renewable Energy, PVHardware, Scorpius Trackers, SmartTrak Solar Systems, Soltec, STI Norland, SunPower Corporation, and Trina Solar. Companies operating in the solar tracker market are implementing multiple strategic initiatives to strengthen their market presence and improve competitive positioning globally. Leading industry participants are investing heavily in research and development activities to introduce advanced tracking systems with enhanced efficiency, durability, and intelligent automation capabilities. Strategic partnerships, acquisitions, and collaborations with renewable energy developers are helping companies expand their global footprint and strengthen project portfolios. Organizations are also focusing on integrating smart monitoring technologies, artificial intelligence, and IoT-enabled control systems to improve energy optimization and operational performance. Increasing investments in lightweight materials and cost-efficient manufacturing processes are further supporting product innovation and scalability.
Table of Contents
Chapter 1 Methodology & Scope
- 1.1 Research design
- 1.2 Quality commitment
- 1.2.1 GMI AI policy & data integrity commitment
- 1.2.1.1 Source consistency protocol
- 1.2.1 GMI AI policy & data integrity commitment
- 1.3 Research trail & confidence scoring
- 1.3.1 Research trail components
- 1.3.2 Scoring components
- 1.4 Data collection
- 1.4.1 Partial list of primary sources
- 1.5 Data mining sources
- 1.5.1 Paid sources
- 1.5.1.1 Sources, by region
- 1.5.1 Paid sources
- 1.6 Base estimates and calculations
- 1.6.1 Base year calculation for any one approach
- 1.7 Forecast model
- 1.8 Research transparency addendum
- 1.8.1 Source attribution framework
- 1.8.2 Quality assurance metrics
- 1.8.3 Our commitment to trust
- 1.9 Market definitions
Chapter 2 Executive Summary
- 2.1 Industry 360-degree synopsis, 2022 - 2035
- 2.2 Business trends
- 2.3 Technology trends
- 2.4 Product trends
- 2.5 Application trends
- 2.6 Regional trends
Chapter 3 Industry Insights
- 3.1 Industry ecosystem
- 3.1.1 Raw Material Suppliers
- 3.1.2 Component Manufacturers
- 3.1.3 Tracker assembly & integration
- 3.1.4 Distributors & system integrators
- 3.1.5 EPC contractors & project developers
- 3.1.6 End users
- 3.2 Regulatory landscape
- 3.2.1 Global policy & incentive programs
- 3.2.2 Net metering & feed-in tariff mechanisms
- 3.2.3 Carbon credit & renewable energy certification standards
- 3.2.4 Trade policies & anti-dumping regulations
- 3.3 Technology & innovation landscape
- 3.3.1 IoT & digital integration in tracking systems
- 3.3.2 Advanced materials for durability enhancement
- 3.3.3 Predictive maintenance technologies
- 3.3.4 Linked-row architecture innovations
- 3.4 Industry impact forces
- 3.4.1 Growth drivers
- 3.4.2 Industry pitfalls & challenges
- 3.5 Growth potential analysis
- 3.6 Porter's analysis
- 3.6.1 Bargaining power of suppliers
- 3.6.2 Bargaining power of buyers
- 3.6.3 Threat of new entrants
- 3.6.4 Threat of substitutes
- 3.7 PESTEL analysis
- 3.7.1 Political factors
- 3.7.2 Economic factors
- 3.7.3 Social factors
- 3.7.4 Technological factors
- 3.7.5 Legal factors
- 3.7.6 Environmental factors
- 3.8 Solar PV project database
- 3.8.1 Operational
- 3.8.2 Estimated
- 3.9 Cost structure analysis
- 3.9.1 Bill of Materials Breakdown
- 3.9.2 Manufacturing Cost Evolution & Learning Curve
- 3.9.3 Balance of System Cost Trends
- 3.10 Price trend analysis (Driven by Primary Research)
- 3.10.1 Historical price trend analysis
- 3.10.2 Pricing strategy by player type
- 3.11 Trade data analysis (Driven by Primary Research)
- 3.11.1 Import/export value trends
- 3.11.2 Key trade corridors & tariff impact
- 3.12 Production capacity & utilization (Driven by Primary Research)
- 3.12.1 Production capacity by country
- 3.12.2 Utilization rates and expansion pipeline
- 3.13 Impact of AI & generative AI on the market [SOLUTION CORE]
- 3.13.1 Predictive maintenance & fault detection
- 3.13.2 Grid optimization & load forecasting
- 3.13.3 Digital twin simulation & testing
- 3.13.4 Risks, limitations & regulatory considerations
- 3.14 Emerging opportunities & trends
- 3.15 Digitalization & IoT integration
- 3.16 Investment analysis and future outlook
Chapter 4 Competitive landscape, 2026
- 4.1 Introduction
- 4.2 Company market share analysis, by region, 2025
- 4.2.1 North America
- 4.2.2 Europe
- 4.2.3 Asia Pacific
- 4.2.4 Middle East
- 4.2.5 Africa
- 4.2.6 Latin America
- 4.3 Competitive analysis of major market players
- 4.4 Competitive positioning matrix
- 4.5 Key developments
- 4.5.1 Mergers & acquisitions
- 4.5.2 Partnerships & collaborations
- 4.5.3 New product launches
- 4.5.4 Expansion plans & funding
- 4.6 Company tier benchmarking
- 4.6.1 Tier classification criteria & qualifying thresholds
- 4.6.2 Tier positioning matrix by revenue, geography & innovation
Chapter 5 Market Size and Forecast, By Product, 2022 - 2035 (USD Billion & MW)
- 5.1 Key trends
- 5.2 Single axis
- 5.2.1 Horizontal
- 5.2.2 Vertical
- 5.3 Dual axis
Chapter 6 Market Size and Forecast, By Technology, 2022 - 2035 (USD Billion & MW)
- 6.1 Key trends
- 6.2 PV
- 6.3 CSP
Chapter 7 Market Size and Forecast, By Application, 2022 - 2035 (USD Billion & MW)
- 7.1 Key trends
- 7.2 Residential
- 7.3 Commercial & industrial
- 7.4 Utility
Chapter 8 Market Size and Forecast, By Region, 2022 - 2035 (USD Billion & MW)
- 8.1 Key trends
- 8.2 North America
- 8.2.1 U.S
- 8.2.2 Canada
- 8.2.3 Mexico
- 8.3 Europe
- 8.3.1 UK
- 8.3.2 France
- 8.3.3 Netherlands
- 8.3.4 Germany
- 8.3.5 Sweden
- 8.3.6 Spain
- 8.3.7 Austria
- 8.4 Asia Pacific
- 8.4.1 China
- 8.4.2 Japan
- 8.4.3 South Korea
- 8.4.4 Australia
- 8.4.5 India
- 8.5 Middle East
- 8.5.1 Saudi Arabia
- 8.5.2 UAE
- 8.5.3 Jordan
- 8.5.4 Israel
- 8.6 Africa
- 8.6.1 South Africa
- 8.6.2 Egypt
- 8.6.3 Algeria
- 8.6.4 Nigeria
- 8.6.5 Morocco
- 8.7 Latin America
- 8.7.1 Brazil
- 8.7.2 Chile
Chapter 9 Company Profiles
- 9.1 Arcelormittal
- 9.2 Array Technologies
- 9.3 Arctech
- 9.4 Antai
- 9.5 All Earth Renewables
- 9.6 Clenergy
- 9.7 Convert Italia
- 9.8 Degerenergie
- 9.9 Flexrack
- 9.10 FTC Solar
- 9.11 GameChange Solar
- 9.12 Gonvarri Solar Steel
- 9.13 Haosolar
- 9.14 Ideematec
- 9.15 Mecasolar
- 9.16 Nclave
- 9.17 Nextpower
- 9.18 Powerway Renewable Energy
- 9.19 PVHardware
- 9.20 Solar Steel
- 9.21 Scorpius Trackers
- 9.22 SmartTrak Solar Systems
- 9.23 Soltec
- 9.24 STI Norland
- 9.25 Valmont Industries
- 9.26 Versolsolar
- 9.27 Trina Solar

