PUBLISHER: Global Market Insights Inc. | PRODUCT CODE: 2071203

PUBLISHER: Global Market Insights Inc. | PRODUCT CODE: 2071203
Demand Response Market Opportunity, Growth Drivers, Industry Trend Analysis, and Forecast 2026 - 2035
The Global Demand Response Market was valued at USD 11.1 billion in 2025 and is estimated to grow at a CAGR of 9.1% to reach USD 26.6 billion by 2035.
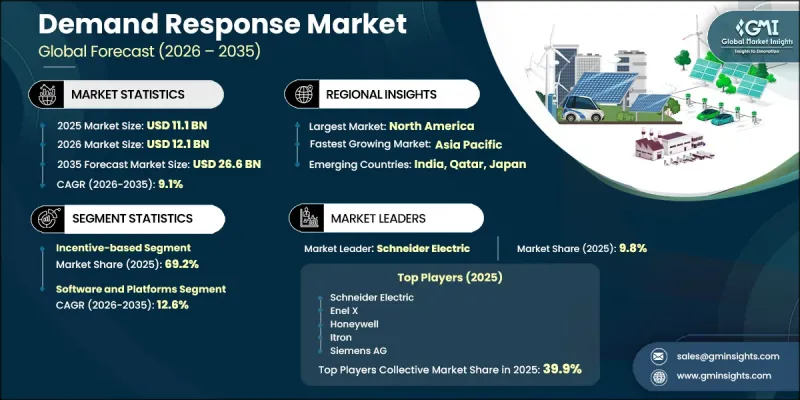
The growth reflects the ongoing transformation of modern power systems as energy providers seek greater flexibility, efficiency, and reliability across electricity networks. Commercial and industrial consumers continue to represent the largest share of program participation, while residential adoption is gaining momentum due to the wider availability of connected energy management technologies and advanced energy aggregation solutions. A notable industry shift is occurring through the adoption of IoT-enabled platforms and artificial intelligence-based optimization tools, which are replacing traditional demand management approaches. As a result, demand response is increasingly being viewed as a strategic grid resource capable of generating economic value rather than solely reducing energy costs. Participation in demand response initiatives offers measurable financial benefits to consumers, helping reduce electricity expenses while creating additional revenue opportunities. However, implementation often requires investment in advanced metering systems, automated controls, communication technologies, and supporting infrastructure, which can present financial challenges for organizations without established smart energy foundations.
| Market Scope | |
|---|---|
| Start Year | 2025 |
| Forecast Year | 2026-2035 |
| Start Value | $11.1 Billion |
| Forecast Value | $26.6 Billion |
| CAGR | 9.1% |
The incentive-based demand response (IBDR) segment held a 69.2% share in 2025. Under these programs, participants receive financial compensation in exchange for reducing or shifting electricity consumption during periods of grid stress or peak demand. Compensation mechanisms may include direct incentives, performance-based payments, or energy bill benefits. The segment continues to maintain its leading position due to strong participation from large-scale energy consumers capable of delivering substantial load flexibility, making incentive-based demand response an important component of modern grid management strategies.
The price-based demand response (PBDR) segment held a 30.8% share in 2025. Growth is driven by the expanding adoption of dynamic electricity pricing models across residential and commercial customer segments. These programs encourage consumers to modify electricity usage patterns in response to changing price signals, enabling more efficient energy consumption without direct intervention from utilities. The segment benefits significantly from the continued rollout of advanced metering infrastructure, which allows utilities to implement sophisticated pricing structures and improve customer engagement through real-time energy management capabilities.
Europe Demand Response Market accounted for 15% share in 2025 and is forecast to grow at a CAGR of 9.8% through 2035. The region continues to benefit from supportive regulatory developments designed to enhance market participation, improve interoperability, and establish standardized operating frameworks. Recent policy initiatives focused on market accessibility, qualification requirements, and data-sharing protocols are helping create a more integrated environment for demand response providers and energy aggregators. These developments are expected to facilitate broader adoption across regional electricity markets while supporting long-term industry expansion and grid modernization efforts.
Key companies operating in the Global Demand Response Industry include Eaton, Oracle Utilities, ABB, Next Kraftwerke, Honeywell, Schneider Electric, GE Vernova, Enel X, Landis+Gyr, Tesla Energy, Siemens AG, Johnson Controls, Centrica Business Solutions, Uplight, and Itron. Leading participants in the demand response market are adopting a variety of strategies to strengthen their competitive position and expand market share. Companies are investing heavily in advanced software platforms, artificial intelligence capabilities, predictive analytics, and cloud-based energy management solutions to enhance operational efficiency and customer value. Strategic partnerships with utilities, technology providers, and energy service organizations are helping businesses broaden their market reach and accelerate solution deployment. Many firms are also pursuing acquisitions and regional expansion initiatives to strengthen their customer base and diversify service offerings. Investments in smart grid integration, distributed energy resource management, and virtual power plant technologies continue to support innovation across the sector.
Table of Contents
Chapter 1 Methodology & Scope
- 1.1 Research design
- 1.2 Quality commitment
- 1.2.1 GMI AI policy & data integrity commitment
- 1.2.1.1 Source consistency protocol
- 1.2.1 GMI AI policy & data integrity commitment
- 1.3 Research Trail & Confidence Scoring
- 1.3.1 Research Trail Components
- 1.3.2 Scoring Components
- 1.4 Data Collection
- 1.4.1 Partial list of primary sources
- 1.5 Data mining sources
- 1.5.1 Paid sources
- 1.5.1.1 Sources, by region
- 1.5.1 Paid sources
- 1.6 Base estimates and calculations
- 1.6.1 Base year calculation for any one approach
- 1.7 Forecast model
- 1.8 Research transparency addendum
- 1.8.1 Source attribution framework
- 1.8.2 Quality assurance metrics
- 1.8.3 Our commitment to trust
- 1.9 Market definitions
Chapter 2 Executive Summary
- 2.1 Industry synopsis, 2022 - 2035
- 2.2 Business trends
- 2.3 Service type trends
- 2.4 Technology trends
- 2.5 Components trends
- 2.6 Deployment trends
- 2.7 Communication trends
- 2.8 Application trends
- 2.9 End user trends
- 2.10 Region trends
Chapter 3 Industry Insights
- 3.1 Industry ecosystem
- 3.2 Regulatory landscape
- 3.2.1 North America
- 3.2.2 Europe
- 3.2.3 Asia Pacific
- 3.2.4 Middle East & Africa
- 3.2.5 Latin America
- 3.3 Industry impact forces
- 3.3.1 Growth drivers
- 3.3.2 Industry pitfalls & challenges
- 3.4 Growth potential analysis
- 3.5 Porter's analysis
- 3.5.1 Bargaining power of suppliers
- 3.5.2 Bargaining power of buyers
- 3.5.3 Threat of new entrants
- 3.5.4 Threat of substitutes
- 3.6 PESTEL analysis
- 3.6.1 Political factors
- 3.6.2 Economic factors
- 3.6.3 Social factors
- 3.6.4 Technological factors
- 3.6.5 Legal factors
- 3.6.6 Environmental factors
- 3.7 Impact of AI & generative AI on the market
- 3.7.1 Predictive maintenance & fault detection
- 3.7.2 Grid optimization & load forecasting
- 3.7.3 Digital twin simulation & testing
- 3.7.4 Risks, limitations & regulatory considerations
- 3.8 Emerging opportunities & trends
- 3.8.1 Digitalization & IoT integration
- 3.8.2 Emerging market penetration
- 3.9 Overall investment scenario and future outlook
Chapter 4 Competitive landscape, 2026
- 4.1 Introduction
- 4.2 Company market share analysis, by region, 2025
- 4.2.1 North America
- 4.2.2 Europe
- 4.2.3 Asia Pacific
- 4.2.4 Middle East & Africa
- 4.2.5 Latin America
- 4.3 Competitive analysis of major market players
- 4.4 Competitive positioning matrix
- 4.5 Key developments
- 4.5.1 Mergers & acquisitions
- 4.5.2 Partnerships & collaborations
- 4.5.3 New product launches
- 4.5.4 Expansion plans & funding
- 4.6 Company tier benchmarking
- 4.6.1 Tier classification criteria & qualifying thresholds
- 4.6.2 Tier positioning matrix by revenue, geography & innovation
Chapter 5 Market Size and Forecast, By Service type, 2022 - 2035 (USD Billion)
- 5.1 Key trends
- 5.2 Incentive-based DR
- 5.3 Price-based DR
Chapter 6 Market Size and Forecast, By Technology, 2022 - 2035 (USD Billion)
- 6.1 Key trends
- 6.2 Advanced metering infrastructure (AMI)
- 6.3 Energy management systems (EMS)
- 6.4 Automated demand response (ADR)
- 6.5 Smart thermostats & HVAC control
- 6.6 IoT & AI-based DR platforms
- 6.7 Virtual power plant (VPP) platforms
- 6.8 Others
Chapter 7 Market Size and Forecast, By Component, 2022 - 2035 (USD Billion)
- 7.1 Key trends
- 7.2 Software & platforms
- 7.3 Hardware
- 7.4 Services
Chapter 8 Market Size and Forecast, By Deployment, 2022 - 2035 (USD Billion)
- 8.1 Key trends
- 8.2 Cloud-based
- 8.3 On-premises
- 8.4 Hybrid
Chapter 9 Market Size and Forecast, By Communication, 2022 - 2035 (USD Billion)
- 9.1 Key trends
- 9.2 Wired
- 9.3 Wireless
Chapter 10 Market Size and Forecast, By Application, 2022 - 2035 (USD Billion)
- 10.1 Key trends
- 10.2 Peak load management
- 10.3 Grid reliability & scalability
- 10.4 Energy cost optimization
- 10.5 Renewable integration
- 10.6 Ancillary services & frequency reg.
- 10.7 Others
Chapter 11 Market Size and Forecast, By End user, 2022 - 2035 (USD Billion)
- 11.1 Key trends
- 11.2 Industrial
- 11.3 Commercial
- 11.4 Residential
- 11.5 Utilities
Chapter 12 Market Size and Forecast, By Region, 2022 - 2035 (USD Billion)
- 12.1 Key trends
- 12.2 North America
- 12.2.1 U.S.
- 12.2.2 Canada
- 12.3 Europe
- 12.3.1 UK
- 12.3.2 Germany
- 12.3.3 France
- 12.3.4 Italy
- 12.3.5 Spain
- 12.3.6 Russia
- 12.4 Asia Pacific
- 12.4.1 China
- 12.4.2 South Korea
- 12.4.3 Japan
- 12.4.4 India
- 12.4.5 Australia
- 12.4.6 Southeast Asia
- 12.5 Middle East & Africa
- 12.5.1 Saudi Arabia
- 12.5.2 UAE
- 12.5.3 Qatar
- 12.5.4 South Africa
- 12.6 Latin America
- 12.6.1 Brazil
- 12.6.2 Mexico
- 12.6.3 Argentina
Chapter 13 Company Profiles
- 13.1 ABB
- 13.2 Centrica Business Solutions
- 13.3 CPower Energy Management
- 13.4 Eaton
- 13.5 Enel X
- 13.6 EnergyHub
- 13.7 GE Vernova
- 13.8 Honeywell
- 13.9 Itron
- 13.10 Johnson Controls
- 13.11 Landis+Gyr
- 13.12 Leap
- 13.13 Next Kraftwerke
- 13.14 OhmConnect
- 13.15 Oracle Utilities
- 13.16 Schneider Electric
- 13.17 Siemens AG
- 13.18 Tesla Energy
- 13.19 Uplight
- 13.20 Voltus Inc.

