
PUBLISHER: Mordor Intelligence | PRODUCT CODE: 2064408

PUBLISHER: Mordor Intelligence | PRODUCT CODE: 2064408
Asia-Pacific Demand Response Management System - Market Share Analysis, Industry Trends & Statistics, Growth Forecasts (2026 - 2031)
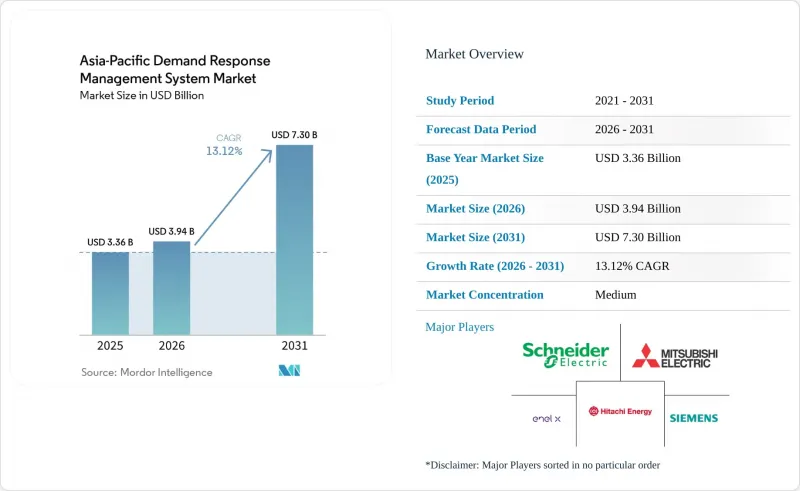
According to Mordor Intelligence, the asia-Pacific demand response management system market size was valued at USD 3.36 billion in 2025 and is estimated to grow from USD 3.94 billion in 2026 to reach USD 7.30 billion by 2031, at a CAGR of 13.12% during the forecast period (2026-2031).
This report is Segmented by Type (Conventional, Others), Program Type (Price-Based, Others), Solution Component (Hardware, Others), Deployment Mode (Cloud-Hosted, Others), End-Use (Residential, More), and Geography (Australia and New Zealand, China, India, Japan, South Korea, ASEAN Countries, Rest of Asia Pacific). The Market Forecasts are Provided in Terms of Value (USD).
Asia-Pacific Demand Response Management System Market Trends and Insights
Rapid Roll-Out of Region-Wide Capacity Markets
Japan activated its capacity market in 2024 and cleared roughly 1 GW of demand-response contracts in the first auction cycle, with 19 dispatch events during the 2024 summer peak Enel X. Australia's Wholesale Demand Response mechanism scaled from 69 MW in 2023 to 92 MW by June 2025, delivering net system benefits of AUD 5.32 million against costs below AUD 0.5 million. South Korea adopted semi-centralized dispatch rules in spring 2026, allowing VPP aggregators to pool sub-20 MW assets and targeting 16.3 GW of peak reduction by 2038. These frameworks convert flexible load into a bankable revenue stream, enabling aggregators to finance telemetry infrastructure and machine-learning analytics that sharpen baseline accuracy.
Surge in Flexible, Behind-the-Meter PV-Plus-Storage
Asia-Pacific absorbed 58% of the 14.8 GWh of new residential batteries installed worldwide in 2025, a 42% jump from 2024. Japan added 180,000 vehicle-to-home chargers by year-end 2025, empowering electric-vehicle owners to arbitrage peak and off-peak tariffs. Australia surpassed 500,000 cumulative home-battery installations, while China's household storage segment expanded 87% in 2025 on the back of provincial self-consumption subsidies NDRC. Each incremental battery lowers the marginal cost of VPP dispatch, shortening vendor payback periods and expanding the residential addressable base of the demand response management system market.
Disparate Tariff Structures Across National Regulators
ASEAN members operate divergent time-of-use windows, critical-peak triggers, and capacity-payment formulas that complicate cross-border VPP aggregation. India's state-level tariff patchwork forces aggregators to juggle conflicting peak definitions, reducing scale efficiencies. China's provincial capacity markets impose localized dispatch priorities, creating higher customer-acquisition costs and longer payback periods for software vendors.
Other drivers and restraints analyzed in the detailed report include:
- Smart-Meter Mandate Completions
- Green Data-Center Procurement of DR Capacity
- Low Residential Participation Due to Aggregator Caps
For complete list of drivers and restraints, kindly check the Table Of Contents.
Segment Analysis
Automated platforms owned 63.8% of 2025 revenue in the demand response management system market and are forecast to expand at 14.8% CAGR through 2031. Their dominance is anchored in sub-second response times that enable ancillary-services participation. South Korea's real-time market expansion in 2025 allows 5-minute bidding, a cadence impossible for conventional manual schemes. Japan's summer 2024 dispatch logged 7 GWh from automated portfolios, confirming reliability at utility scale. As battery penetration rises, machine-learning-driven orchestration that cycles storage multiple times per day will widen the performance gap over conventional systems, solidifying automation's leadership position in the demand response management system market size discussions.
Conventional programs still manage legacy industrial contracts that do not require rapid telemetry, yet their share declines annually as utilities embed hard telemetry and cloud APIs into new tenders. The incremental cost of adding automated logic is falling because most new smart-meter rollouts now include advanced communications modules. Consequently, even smaller commercial facilities find it cost-effective to migrate from opt-in phone notifications to fully automated curtailment.
Price-based tariffs still generated 59.5% of 2025 revenue; however, incentive schemes are projected to grow at 14.5% CAGR to 2031. Capacity auctions in Japan and South Korea, reserve markets in the Philippines, and emergency curtailment contracts in Australia stack capacity, energy, and ancillary revenues, improving aggregator economics. Industrial customers favor guaranteed fees over volatile bill savings, shifting procurement toward incentive models and expanding the demand response management system market share of availability payments.
Residential segments remain anchored to time-of-use tariffs because utilities can implement them with billing upgrades alone. Yet behavioral fatigue erodes response over time, prompting regulators to pilot blended models that add small capacity bonuses to retain engagement. Growing deployment of home batteries and vehicle-to-home chargers will accelerate the pivot toward automated incentive programs in the back half of the forecast period.
List of Companies Covered in this Report:
- Schneider Electric SE
- Siemens AG
- Hitachi Energy Ltd
- Mitsubishi Electric Corp.
- ABB Ltd.
- Enel X (Enel SpA)
- Eaton Corp. plc
- Itron Inc. (ex-Silver Spring Networks)
- AutoGrid Systems Inc.
- CPower Energy Management
- Tata Power Delhi Distribution
- KEPCO (Korea Electric Power Corp.)
- Landis+Gyr Group
- Digital Energy Corp. (Japan)
- Comverge (now ICF)
- EnerNOC (now Enel X)
- Regen Energy (now Encycle)
- Yokogawa Electric Corp.
- Nuvve Holding Corp.
- GridPoint Inc.
Additional Benefits:
- The market estimate (ME) sheet in Excel format
- 3 months of analyst support
TABLE OF CONTENTS
1 Introduction
- 1.1 Study Assumptions & Market Definition
- 1.2 Scope of the Study
2 Research Methodology
3 Executive Summary
4 Market Landscape
- 4.1 Market Overview
- 4.2 Market Drivers
- 4.2.1 Rapid roll-out of region-wide capacity markets
- 4.2.2 Surge in flexible, behind-the-meter PV-plus-storage
- 4.2.3 Smart-meter mandate completions (Japan 2025; India 2027)
- 4.2.4 Green data-centre procurement of DR capacity
- 4.2.5 Electrification of industrial boilers in China & S-Korea
- 4.3 Market Restraints
- 4.3.1 Disparate tariff structures across national regulators
- 4.3.2 Low residential participation due to aggregator caps
- 4.3.3 Cyber-security spending lag at distribution utilities
- 4.4 Supply-Chain Analysis
- 4.5 Regulatory Landscape
- 4.6 Technological Outlook
- 4.7 Porter's Five Forces
- 4.7.1 Bargaining Power of Suppliers
- 4.7.2 Bargaining Power of Consumers
- 4.7.3 Threat of New Entrants
- 4.7.4 Threat of Substitute Products & Services
- 4.7.5 Intensity of Competitive Rivalry
5 Market Size & Growth Forecasts
- 5.1 By Type
- 5.1.1 Conventional Demand Response
- 5.1.2 Automated/Advanced Demand Response
- 5.2 By Program Type
- 5.2.1 Price-based (TOU, CPP, RTP)
- 5.2.2 Incentive-based (CBP, DLC, Emergency DR, Ancillary)
- 5.3 By Solution Component
- 5.3.1 Hardware (AMI, Load-control switches, Gateways)
- 5.3.2 Software (DRMS, VPP platforms)
- 5.3.3 Services (Aggregation, Curtailment, Enrolment)
- 5.4 By Deployment Mode
- 5.4.1 Cloud-hosted
- 5.4.2 On-premise/Edge
- 5.5 By End-use
- 5.5.1 Residential
- 5.5.2 Commercial
- 5.5.3 Industrial
- 5.6 By Geography
- 5.6.1 Australia
- 5.6.2 China
- 5.6.3 India
- 5.6.4 Japan
- 5.6.5 South Korea
- 5.6.6 ASEAN Countries
- 5.6.7 Australia and New Zealand
- 5.6.8 Rest of Asia-Pacific
6 Competitive Landscape
- 6.1 Market Concentration
- 6.2 Strategic Moves (M&A, Partnerships, PPAs)
- 6.3 Market Share Analysis (Market Rank/Share for key companies)
- 6.4 Company Profiles (includes Global level Overview, Market level overview, Core Segments, Financials as available, Strategic Information, Products & Services, and Recent Developments)
- 6.4.1 Schneider Electric SE
- 6.4.2 Siemens AG
- 6.4.3 Hitachi Energy Ltd
- 6.4.4 Mitsubishi Electric Corp.
- 6.4.5 ABB Ltd.
- 6.4.6 Enel X (Enel SpA)
- 6.4.7 Eaton Corp. plc
- 6.4.8 Itron Inc. (ex-Silver Spring Networks)
- 6.4.9 AutoGrid Systems Inc.
- 6.4.10 CPower Energy Management
- 6.4.11 Tata Power Delhi Distribution
- 6.4.12 KEPCO (Korea Electric Power Corp.)
- 6.4.13 Landis+Gyr Group
- 6.4.14 Digital Energy Corp. (Japan)
- 6.4.15 Comverge (now ICF)
- 6.4.16 EnerNOC (now Enel X)
- 6.4.17 Regen Energy (now Encycle)
- 6.4.18 Yokogawa Electric Corp.
- 6.4.19 Nuvve Holding Corp.
- 6.4.20 GridPoint Inc.
7 Market Opportunities & Future Outlook
- 7.1 White-space & Unmet-need Assessment

