
PUBLISHER: Global Market Insights Inc. | PRODUCT CODE: 2071414

PUBLISHER: Global Market Insights Inc. | PRODUCT CODE: 2071414
EV Connector Market Opportunity, Growth Drivers, Industry Trend Analysis, and Forecast 2026 - 2035
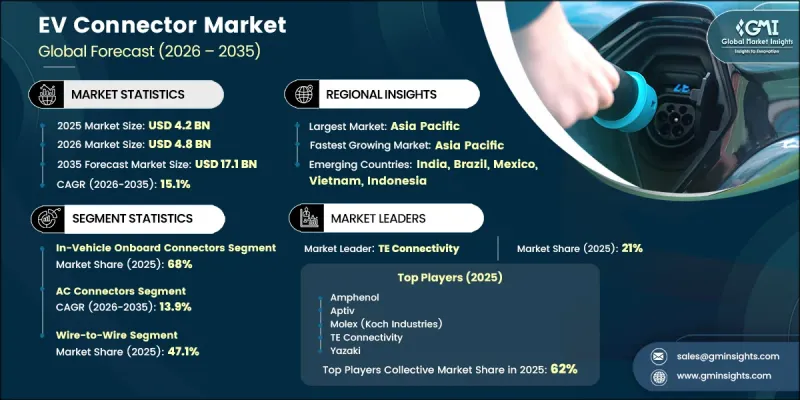
The Global EV Connector Market was valued at USD 4.2 billion in 2025 and is estimated to grow at a CAGR of 15.1% to reach USD 17.1 billion by 2035.
The market expansion is driven by a structural transformation in the automotive industry, where electrification is significantly broadening the application scope of EV connectors across charging infrastructure and in-vehicle systems. Growth is not only volume-driven but also shaped by increasing diversity in electric mobility platforms, including passenger battery electric vehicles, commercial EVs, and electric two-wheelers, each requiring specialized connector solutions. Rising EV production levels are further increasing connector content per vehicle, particularly with the adoption of high-voltage architectures. Government investments in charging infrastructure are accelerating deployment rates globally. A major technological shift toward 800V electrical systems is also reshaping the industry, enabling faster charging speeds and improved drivetrain efficiency. Automakers are increasingly transitioning from 400V to 800V platforms to reduce charging times and support high-performance electric vehicles, which is significantly strengthening demand for advanced connector technologies.
| Market Scope | |
|---|---|
| Start Year | 2025 |
| Forecast Year | 2026-2035 |
| Start Value | $4.2 Billion |
| Forecast Value | $17.1 Billion |
| CAGR | 15.1% |
The in-vehicle onboard connectors segment held a 68% share in 2025 and is expected to grow at a CAGR of 14.5% from 2026 to 2035. This segment is being reshaped by the shift toward zonal electrical architectures, which replace traditional complex wiring systems with more centralized computing models. This transition reduces wiring complexity, lowers vehicle weight, and enhances data transmission efficiency, further strengthening the demand for advanced onboard connector systems.
The wire-to-wire segment accounted for 47.1% share in 2025 and is projected to grow at a CAGR of 14.3% during 2026-2035. Wire-to-wire connectors continue to be widely used in EV platforms due to their reliability and straightforward design for power and signal transfer. Although their dominance is gradually easing due to evolving compact electronic architectures, they remain essential for power distribution systems, legacy wiring setups, and applications requiring high durability in automotive environments.
U.S. EV Connector Market reached USD 745.5 million in 2025 and is projected to grow at a CAGR of 14.8% through 2035. Market growth is being shaped by the transition toward the Tesla NACS charging standard, which is influencing connector design strategies across OEMs and charging infrastructure operators. This shift is increasing demand for dual-compatible and high-voltage DC connectors while helping reduce ecosystem fragmentation. Federal NEVI funding is also supporting large-scale deployment of highway fast-charging networks, further strengthening market expansion.
Major players operating in the EV connector industry include ABB, Amphenol, Aptiv, Harting, Hirose Electric, ITT, Mennekes Elektrotechnik, Molex (Koch Industries), Phoenix Contact, Rosenberger, Sumitomo Electric, TE Connectivity, and Yazaki. Companies in the EV connector market are prioritizing the development of high-voltage and fast-charging compatible connector systems to align with evolving EV architectures. Strong investment in R&D is enabling improved thermal performance, miniaturization, and durability. Strategic partnerships with automakers and charging infrastructure providers help accelerate product standardization and ecosystem compatibility. Manufacturers are expanding production capacities to meet rising EV demand while strengthening supply chain resilience. Integration of smart connectors with enhanced data communication capabilities is also gaining traction.
Table of Contents
Chapter 1 Methodology
- 1.1 Research approach
- 1.2 Quality commitments
- 1.3 GMI AI policy & data integrity commitment
- 1.4 Research trail & confidence scoring
- 1.4.1 Research trail components
- 1.4.2 Scoring components
- 1.5 Data collection
- 1.5.1 Partial list of primary sources
- 1.6 Data mining sources
- 1.6.1 Paid sources
- 1.7 Base estimates and calculations
- 1.7.1 Base year calculation
- 1.8 Forecast model
- 1.9 Research transparency addendum
Chapter 2 Executive Summary
- 2.1 Industry 360° synopsis
- 2.2 Key market trends
- 2.2.1 Regional
- 2.2.2 Connector
- 2.2.3 Current
- 2.2.4 Application
- 2.2.5 Voltage
- 2.2.6 Connection
- 2.3 TAM analysis, 2026-2035
- 2.4 CXO perspectives: Strategic imperatives
Chapter 3 Industry Insights
- 3.1 Industry ecosystem analysis
- 3.1.1 Supplier landscape
- 3.1.2 Profit margin
- 3.1.3 Cost structure
- 3.1.4 Value addition at each stage
- 3.1.5 Factor affecting the value chain
- 3.1.6 Disruptions
- 3.2 Industry impact forces
- 3.2.1 Growth drivers
- 3.2.1.1 Rapid EV adoption growth
- 3.2.1.2 Charging infrastructure expansion
- 3.2.1.3 High-voltage platform shift
- 3.2.1.4 Increasing onboard electronics density
- 3.2.2 Industry pitfalls and challenges
- 3.2.2.1 Standard fragmentation complexity
- 3.2.2.2 Raw material price volatility
- 3.2.3 Market opportunities
- 3.2.3.1 Wireless charging emergence
- 3.2.3.2 Heavy-duty EV electrification
- 3.2.3.3 Emerging market expansion
- 3.2.3.4 Smart connector integration
- 3.2.1 Growth drivers
- 3.3 Growth potential analysis
- 3.4 Technology and innovation landscape
- 3.4.1 Current technological trends
- 3.4.2 Emerging technologies
- 3.5 Pricing analysis (Driven by Primary Research)
- 3.5.1 Historical price trend analysis
- 3.5.2 Pricing strategy by player type (premium / value / cost-plus)
- 3.6 Regulatory landscape
- 3.6.1 North America
- 3.6.1.1 SAE International
- 3.6.1.2 National Highway Traffic Safety Administration (NHTSA)
- 3.6.2 Europe
- 3.6.2.1 European Commission (EC)
- 3.6.2.2 European Committee for Standardization (CEN-CENELEC)
- 3.6.3 Asia Pacific
- 3.6.3.1 Ministry of Industry and Information Technology (MIIT, China)
- 3.6.3.2 Bureau of Indian Standards (BIS)
- 3.6.4 Latin America
- 3.6.4.1 National Institute of Metrology, Quality and Technology (INMETRO - Brazil)
- 3.6.4.2 Mexican Secretariat of Economy (SE)
- 3.6.5 Middle East & Africa
- 3.6.5.1 Gulf Standardization Organization (GSO)
- 3.6.5.2 South African Bureau of Standards (SABS)
- 3.6.1 North America
- 3.7 Porter's analysis
- 3.8 PESTEL analysis
- 3.9 Patent analysis (Driven by Primary Research)
- 3.10 Trade data analysis (Driven by paid database)
- 3.10.1 Import/export volume & value trends
- 3.10.2 Key trade corridors & tariff impact
- 3.11 Impact of AI & Generative AI on the Market
- 3.11.1 AI-driven disruption of existing business models
- 3.11.2 Gen AI use cases & adoption roadmap by segment
- 3.11.3 Risks, limitations & regulatory considerations
- 3.12 Capacity & Production Landscape (Driven by Primary Research)
- 3.12.1 Production Capacity by Region & Key Producer
- 3.12.2 Capacity Utilization Rates & Expansion Pipelines
- 3.13 Sustainability and environmental aspects
- 3.13.1 Sustainable practices
- 3.13.2 Waste reduction strategies
- 3.13.3 Energy efficiency in production
- 3.13.4 Eco-friendly initiatives
- 3.13.5 Carbon footprint considerations
- 3.14 Forecast assumptions & scenario analysis (Driven by primary research)
- 3.14.1 Base Case - key macro & industry variables driving CAGR
- 3.14.2 Optimistic Scenarios - Favorable macro and industry tailwinds
- 3.14.3 Pessimistic Scenario - Macroeconomic slowdown or industry headwinds
Chapter 4 Competitive Landscape, 2025
- 4.1 Introduction
- 4.2 Company market share analysis
- 4.2.1 North America
- 4.2.2 Europe
- 4.2.3 Asia Pacific
- 4.2.4 LATAM
- 4.2.5 MEA
- 4.3 Competitive analysis of major market players
- 4.4 Competitive positioning matrix
- 4.5 Key developments
- 4.5.1 Mergers & acquisitions
- 4.5.2 Partnerships & collaborations
- 4.5.3 New product launches
- 4.5.4 Expansion plans and funding
Chapter 5 Market Estimates & Forecast, By Connector, 2022 - 2035 ($Mn, Mn units)
- 5.1 Key trends
- 5.2 Charging interface connectors
- 5.3 In-vehicle onboard connectors
Chapter 6 Market Estimates & Forecast, By Current, 2022 - 2035 ($Mn, Mn units)
- 6.1 Key trends
- 6.2 AC connectors
- 6.3 DC connectors
- 6.4 Combined AC/DC connectors
Chapter 7 Market Estimates & Forecast, By Application, 2022 - 2035 ($Mn, Mn units)
- 7.1 Key trends
- 7.2 Charging
- 7.3 Body control & interiors
- 7.4 Infotainment systems
- 7.5 Powertrain & engine management
- 7.6 Battery management system
- 7.7 Others
Chapter 8 Market Estimates & Forecast, By Voltage, 2022 - 2035 ($Mn, Mn units)
- 8.1 Key trends
- 8.2 Low voltage connectors (<60V)
- 8.3 Medium voltage connectors (60V-400V)
- 8.4 High voltage connectors (>400V)
Chapter 9 Market Estimates & Forecast, By Connection, 2022 - 2035 ($Mn, Mn units)
- 9.1 Key trends
- 9.2 Wire-to-wire
- 9.3 Wire-to-board
- 9.4 Board-to-board
Chapter 10 Market Estimates & Forecast, By Region, 2022 - 2035 ($Mn, Mn units)
- 10.1 Key trends
- 10.2 North America
- 10.2.1 U.S.
- 10.2.2 Canada
- 10.3 Europe
- 10.3.1 Germany
- 10.3.2 France
- 10.3.3 UK
- 10.3.4 Italy
- 10.3.5 Spain
- 10.3.6 Netherlands
- 10.3.7 Sweden
- 10.3.8 Norway
- 10.3.9 Poland
- 10.3.10 Belgium
- 10.4 Asia Pacific
- 10.4.1 China
- 10.4.2 India
- 10.4.3 Japan
- 10.4.4 South Korea
- 10.4.5 Indonesia
- 10.4.6 Vietnam
- 10.4.7 Thailand
- 10.4.8 Malaysia
- 10.4.9 Australia
- 10.4.10 Singapore
- 10.5 Latin America
- 10.5.1 Brazil
- 10.5.2 Mexico
- 10.5.3 Argentina
- 10.6 MEA
- 10.6.1 South Africa
- 10.6.2 Saudi Arabia
- 10.6.3 UAE
Chapter 11 Company Profiles
- 11.1 Global players
- 11.1.1 Amphenol
- 11.1.2 Aptiv
- 11.1.3 Hirose Electric
- 11.1.4 Molex
- 11.1.5 Rosenberger Hochfrequenztechnik
- 11.1.6 Sumitomo Electric Industries
- 11.1.7 TE Connectivity
- 11.1.8 Yazaki
- 11.2 Regional players
- 11.2.1 Fujikura
- 11.2.2 Furukawa Electric
- 11.2.3 HUBER+SUHNER
- 11.2.4 JST (Japan Solderless Terminal)
- 11.2.5 KOSTAL
- 11.2.6 Leoni
- 11.2.7 Mennekes Elektrotechnik
- 11.2.8 Phoenix Contact E-Mobility
- 11.3 Emerging players
- 11.3.1 JONHON (Avic Jonhon Optronic)
- 11.3.2 Luxshare-ICT
- 11.3.3 SINBON Electronics
- 11.3.4 Yonggui Electric Equipment

