
PUBLISHER: Global Market Insights Inc. | PRODUCT CODE: 2083041

PUBLISHER: Global Market Insights Inc. | PRODUCT CODE: 2083041
North America Smart Home Market Opportunity, Growth Drivers, Industry Trend Analysis, and Forecast 2026 - 2035
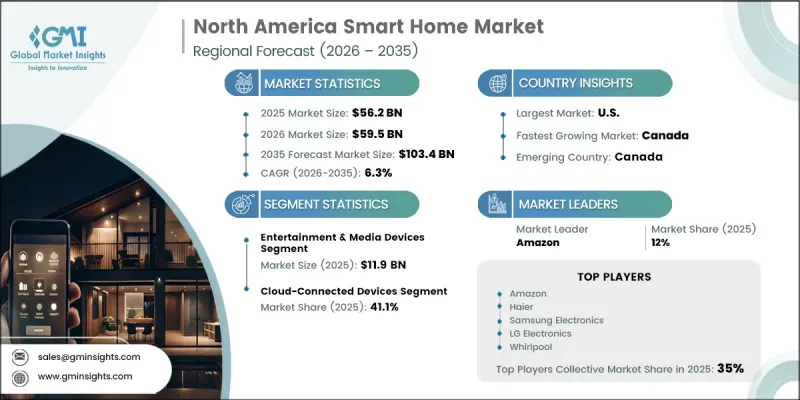
North America Smart Home Market was valued at USD 56.2 billion in 2025 and is estimated to grow at a CAGR of 6.3% to reach USD 103.4 billion by 2035.
North America smart home market continues to gain momentum as consumers place greater emphasis on convenience, safety, energy efficiency, and greater control over household operations. Residential properties are steadily transforming into connected environments where multiple home systems function together to improve comfort and simplify everyday living. The widespread use of smartphones, connected devices, and digital technologies has accelerated consumer acceptance of smart home solutions, making these products a practical choice for households rather than a premium lifestyle purchase. Growing awareness of home automation, combined with rising demand for intelligent energy management, advanced security, and personalized living experiences, is encouraging adoption across a broad consumer base. Market participants continue to focus on improving interoperability, reliability, and ease of use to deliver seamless user experiences. Consumers increasingly prefer solutions that require minimal installation effort and intuitive operation, allowing them to integrate connected technologies into their homes without specialized technical expertise. Continuous product innovation, expanding connected ecosystems, and increasing digital adoption are expected to support long-term market expansion across the region.
| Market Scope | |
|---|---|
| Start Year | 2025 |
| Forecast Year | 2026-2035 |
| Start Value | $56.2 Billion |
| Forecast Value | $103.4 Billion |
| CAGR | 6.3% |
In 2025, the entertainment & media devices segment accounted for USD 11.9 billion. The segment maintains its leading position because entertainment-focused smart devices provide immediate benefits, are easy for consumers to adopt, and build upon familiar household electronics. Strong consumer demand, rapid replacement cycles, and broad compatibility with connected home ecosystems continue to support growth in this category. Increasing interest in immersive home entertainment experiences and integrated digital platforms further strengthens the segment's market leadership.
The cloud-connected devices segment held 41.1% share in 2025. Cloud-based connectivity enables multiple smart home devices to communicate efficiently through centralized platforms, allowing remote management, automatic software updates, and synchronized device performance. Continued investments in high-speed broadband infrastructure and the expansion of next-generation wireless connectivity have created a reliable digital foundation for homes equipped with multiple connected devices. As households adopt larger smart home ecosystems, cloud connectivity remains essential for delivering seamless performance, scalability, and convenient remote access.
U.S. Smart Home Market accounted for 88% share, generating USD 49.7 billion in 2025. Strong broadband availability, high smartphone penetration, and widespread consumer familiarity with connected technologies continue to support market growth throughout the country. Demand remains diversified across home security, energy management, entertainment, and household automation applications. Subscription-based digital services and connected home platforms also contribute significantly to recurring revenue, strengthening the overall market and encouraging continued investment in smart home technologies.
Major companies operating in the North America smart home market include Amazon, Apple, Google, Samsung, LG Electronics, Haier (GE Appliances), Honeywell, Crestron Electronics, Lutron Electronics, Signify (Philips Hue), Assa Abloy (Yale/August), ecobee, Whirlpool Corporation, TP-Link (Kasa Smart), Snap One (Control4), Allegion (Schlage Connect), Chamberlain Group (myQ), Sonos, Legrand North America, Aqara (Lumi United), and Leviton Manufacturing. Companies operating in the North America smart home market are strengthening their market position through continuous product innovation, expansion of connected ecosystems, and strategic investments in research and development. Many participants prioritize improving device compatibility, enhancing software capabilities, and delivering seamless integration across multiple smart home platforms to improve customer experience. Businesses are also expanding their distribution networks, strengthening retail partnerships, and increasing direct-to-consumer sales channels to improve product accessibility. Subscription-based digital services and recurring software offerings continue to create long-term customer relationships while generating stable revenue streams.
Table of Contents
Chapter 1 Research Methodology
- 1.1 Research approach
- 1.2 Quality Commitments
- 1.2.1 GMI AI policy & data integrity commitment
- 1.2.1.1 Source consistency protocol
- 1.2.1 GMI AI policy & data integrity commitment
- 1.3 Research Trail & Confidence Scoring
- 1.3.1 Research Trail Components
- 1.3.2 Scoring Components
- 1.4 Data Collection
- 1.4.1 Partial list of primary sources
- 1.5 Data mining sources
- 1.5.1 Paid sources
- 1.5.1.1 Sources, by region
- 1.5.1 Paid sources
- 1.6 Base estimates and calculations
- 1.6.1 Base year calculation for any one approach
- 1.7 Forecast model
- 1.7.1 Quantified market impact analysis
- 1.7.1.1 Mathematical impact of growth parameters on forecast
- 1.7.1 Quantified market impact analysis
- 1.8 Research transparency addendum
- 1.8.1 Source attribution framework
- 1.8.2 Quality assurance metrics
- 1.8.3 Our commitment to trust
Chapter 2 Executive Summary
- 2.1 Industry 360°synopsis
- 2.2 Key trends
- 2.3 Type
- 2.4 Connectivity
- 2.5 Price Range
- 2.6 Application
Chapter 3 Industry Insights
- 3.1 Industry ecosystem analysis
- 3.1.1 Value chain structure
- 3.1.2 Component manufacturers & suppliers
- 3.1.3 Device manufacturers/OEMs
- 3.1.4 Platform & software providers
- 3.1.5 Distribution & retail layer
- 3.1.6 Installation & integration services
- 3.1.7 End-user/consumer layer
- 3.1.8 Profit margin analysis by value chain stage
- 3.1.9 Value chain disruptions & disintermediation trends
- 3.2 Industry impact forces
- 3.2.1 Growth drivers
- 3.2.2 Industry pitfalls & challenges
- 3.2.3 Opportunities
- 3.3 Growth potential analysis
- 3.4 Supply chain analysis
- 3.4.1 Component supply chain structure
- 3.4.2 Semiconductor dependency & chip shortage impact
- 3.4.3 Manufacturing footprint
- 3.4.4 Logistics & distribution networks
- 3.4.5 Supply chain risks & mitigation strategies
- 3.4.6 Reshoring & nearshoring trends
- 3.5 Regulation Coverage
- 3.5.1 U.S. regulatory environment
- 3.5.1.1 FCC wireless device regulations
- 3.5.1.2 State-level privacy laws (CCPA, etc.)
- 3.5.1.3 Energy efficiency standards (Energy Star)
- 3.5.2 Cybersecurity regulations
- 3.5.3 Historical price trend analysis (2022-2024)
- 3.5.4 Pricing strategy by player type
- 3.5.5 Regional price variation
- 3.5.6 Channel-specific pricing dynamics
- 3.5.7 Bundle pricing vs a la carte models
- 3.5.8 Subscription service pricing trends
- 3.5.1 U.S. regulatory environment
- 3.6 Porter's analysis
- 3.7 PESTEL analysis
- 3.8 Impact of AI and generative AI
- 3.8.1 AI-driven disruption of existing business models
- 3.8.1.1 Voice assistants' evolution (GPT integration)
- 3.8.1.2 Predictive automation & learning systems
- 3.8.1.3 Computer vision applications (security, monitoring)
- 3.8.2 GenAI use cases & adoption roadmap by segment
- 3.8.2.1 Personalized home automation routines
- 3.8.2.2 Natural language control interfaces
- 3.8.2.3 Predictive maintenance & energy optimization
- 3.8.2.4 Content generation for smart displays
- 3.8.3 Risks, limitations & regulatory considerations
- 3.8.3.1 Data privacy & AI model training concerns
- 3.8.3.2 Algorithmic bias & fairness issues
- 3.8.3.3 EU AI Act compliance requirements
- 3.8.1 AI-driven disruption of existing business models
Chapter 4 Competitive Landscape, 2025
- 4.1 Introduction
- 4.2 Company market share analysis
- 4.3 Company matrix analysis
- 4.4 Competitive analysis of major market players
- 4.5 Competitive positioning matrix
- 4.6 Key developments
- 4.6.1 Mergers & acquisitions
- 4.6.2 Partnerships & collaborations
- 4.6.3 New product launches
- 4.6.4 Expansion plan
Chapter 5 Smart Home Market Estimates & Forecast, By Type (USD Billion) (Thousand Units)
- 5.1 Key trends
- 5.2 Security & access control systems
- 5.2.1 Security cameras
- 5.2.1.1 Indoor cameras
- 5.2.1.2 Outdoor cameras
- 5.2.1.3 Doorbell cameras
- 5.2.2 Smart locks
- 5.2.2.1 Keypad locks
- 5.2.2.2 Biometric locks
- 5.2.2.3 Retrofit smart lock kits
- 5.2.3 Video door phones/intercoms
- 5.2.4 Remote monitoring software & services
- 5.2.5 Alarm systems & sensors
- 5.2.6 Other security devices
- 5.2.1 Security cameras
- 5.3 Lighting control systems
- 5.3.1 Smart lights/bulbs
- 5.3.1.1 LED smart bulbs
- 5.3.1.2 Smart light strips
- 5.3.2 Relays & switches
- 5.3.2.1 In-wall smart switches
- 5.3.2.2 Plug-in smart outlets
- 5.3.3 Occupancy sensors & motion detectors
- 5.3.4 Dimmers & controllers
- 5.3.5 Other lighting control products
- 5.3.1 Smart lights/bulbs
- 5.4 HVAC & energy management systems
- 5.4.1 Smart thermostats
- 5.4.1.1 Learning thermostats
- 5.4.1.2 Programmable thermostats
- 5.4.2 HVAC sensors (temperature, humidity, air quality)
- 5.4.3 Smart vents & dampers
- 5.4.4 Energy monitoring systems
- 5.4.5 Smart meters
- 5.4.6 Solar panel controllers & inverters
- 5.4.7 Battery storage systems
- 5.4.8 Other HVAC & energy products
- 5.4.1 Smart thermostats
- 5.5 Entertainment & media devices
- 5.5.1 Smart displays/TVs
- 5.5.2 Streaming devices (Roku, Fire TV, Apple TV)
- 5.5.3 Sound bars & speakers
- 5.5.4 Smart speakers (Alexa, Google Home, HomePod)
- 5.5.5 Multiroom audio systems
- 5.5.6 Other entertainment devices
- 5.6 Smart kitchen appliances
- 5.6.1 Smart refrigerators
- 5.6.2 Smart dishwashers
- 5.6.3 Smart cooktops & ranges
- 5.6.4 Smart microwaves & ovens
- 5.6.5 Smart coffee makers
- 5.6.6 Other kitchen appliances
- 5.7 Smart home appliances
- 5.7.1 Smart washing machines & dryers
- 5.7.2 Smart water heaters
- 5.7.3 Smart vacuum cleaners
- 5.7.4 Smart air purifiers & fans
- 5.7.5 Other home appliances
- 5.8 Home healthcare devices
- 5.8.1 Remote patient monitoring systems
- 5.8.2 Fall detection & alert systems
- 5.8.3 Ambient assisted living solutions
- 5.8.4 Smart beds with health sensors
- 5.8.5 Sleep monitoring systems
- 5.8.6 Medication management devices
- 5.8.7 Other healthcare devices
- 5.9 Other smart home devices
- 5.9.1 Smart furniture (non-health)
- 5.9.2 Smart mirrors
- 5.9.3 Smart pet care devices
- 5.9.4 Smart lawn & garden equipment
- 5.9.5 Other connected products
Chapter 6 Smart Home Market Estimates & Forecast, By Connectivity (USD Billion) (Thousand Units)
- 6.1 Key trends
- 6.2 Cloud-connected devices
- 6.2.1 Wi-Fi-based devices
- 6.2.2 Cellular/LTE-based devices
- 6.2.3 Cloud platform dependencies & risks
- 6.3 Local mesh network devices
- 6.3.1 Zigbee protocol devices
- 6.3.2 Z-Wave protocol devices
- 6.3.3 Thread protocol devices
- 6.3.4 Hub requirements & architecture
- 6.4 Proximity-based devices
- 6.4.1 Bluetooth devices
- 6.4.2 Bluetooth Low Energy (BLE) devices
- 6.4.3 NFC-enabled devices
- 6.5 Wired protocol devices
- 6.5.1 Ethernet-connected devices
- 6.5.2 KNX systems
- 6.5.3 Power line communication (PLC)
- 6.6 Matter unified standard devices
Chapter 7 Smart Home Market Estimates & Forecast, By Price Range (USD Billion) (Thousand Units)
- 7.1 Key trends
- 7.2 Low (<$100 per device)
- 7.3 Medium ($100-$500 per device)
- 7.4 High (>$500 per device)
Chapter 8 Smart Home Market Estimates & Forecast, By Application (USD Billion) (Thousand Units)
- 8.1 Key trends
- 8.2 New construction
- 8.3 Retrofit
Chapter 9 Smart Home Market Estimates & Forecast, By Region (USD Billion) (Thousand Units)
- 9.1 Key trends
- 9.2 U.S.
- 9.3 Canada
Chapter 10 Company Profiles
- 10.1 TIER 1: GLOBAL PLAYERS (7)
- 10.1.1 Amazon
- 10.1.2 Apple
- 10.1.3 Google
- 10.1.4 Samsung
- 10.1.5 LG Electronics
- 10.1.6 Haier (GE Appliances)
- 10.1.7 Honeywell
- 10.2 TIER 2: REGIONAL CHAMPIONS (7)
- 10.2.1 Crestron Electronics
- 10.2.2 Lutron Electronics
- 10.2.3 Signify (Philips Hue)
- 10.2.4 Assa Abloy (Yale/August)
- 10.2.5 ecobee
- 10.2.6 Whirlpool Corporation
- 10.2.7 TP-Link (Kasa Smart)
- 10.3 TIER 3: NICHE/SPECIALIST PLAYERS (7)
- 10.3.1 Snap One (Control4)
- 10.3.2 Allegion (Schlage Connect)
- 10.3.3 Chamberlain Group (myQ)
- 10.3.4 Sonos
- 10.3.5 Legrand North America
- 10.3.6 Aqara (Lumi United)
- 10.3.7 Leviton Manufacturing

