PUBLISHER: Global Market Insights Inc. | PRODUCT CODE: 2101910

PUBLISHER: Global Market Insights Inc. | PRODUCT CODE: 2101910
FLNG Market Opportunity, Growth Drivers, Industry Trend Analysis, and Forecast 2026 - 2035
The Global FLNG Market was valued at USD 3.4 billion in 2025 and is estimated to grow at a CAGR of 10.3% to reach USD 8.7 billion by 2035.
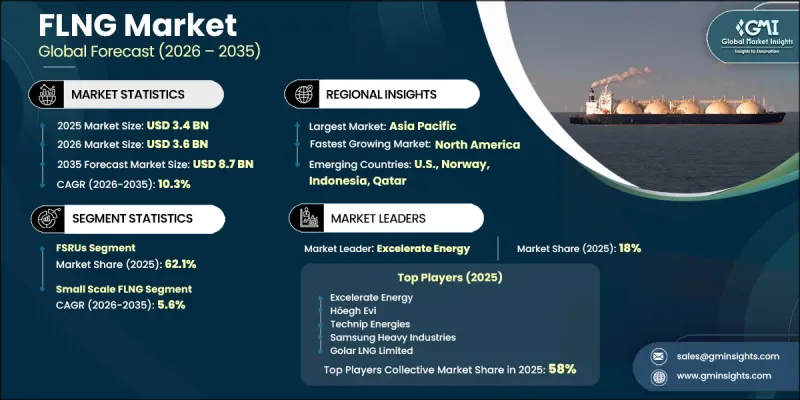
Growth is shaped by the expanding global LNG trade landscape, where floating liquefaction and regasification solutions are increasingly preferred for monetizing offshore gas reserves that are otherwise commercially stranded. FLNG systems are becoming a strategic enabler for gas-producing nations seeking flexible, scalable, and faster-to-deploy alternatives to onshore LNG infrastructure. The technology is already central to national LNG output structures in select offshore-dependent economies, where it supports full-scale production without requiring extensive coastal terminal development. At the same time, global energy transition dynamics, including coal-to-gas switching in Asia and supply diversification in Europe, are reinforcing long-term demand visibility. The growing integration of digital twin systems, AI-enabled predictive maintenance, and advanced modular control architectures is also improving operational uptime and cost efficiency across floating assets. Additionally, vessel conversion strategies and modular FLNG designs are reducing capital intensity, further accelerating adoption across both established and emerging offshore basins.
| Market Scope | |
|---|---|
| Start Year | 2025 |
| Forecast Year | 2026-2035 |
| Start Value | $3.4 Billion |
| Forecast Value | $8.7 Billion |
| CAGR | 10.3% |
FSRU-based solutions segment held 62.1% share in 2025 and is expected to grow at a CAGR of 8.6% through 2035. This leadership reflects the rapid expansion of floating regasification capacity, particularly as global LNG flows have been redirected toward demand-heavy regions following major disruptions in traditional pipeline supply networks. These assets continue to serve as critical infrastructure for bridging supply-demand gaps in gas importing economies, enabling faster deployment compared to conventional onshore terminals.
The small-scale FLNG units with capacities up to 1 Mtpa segment accounted for 15.7% share in 2025 and are projected to grow at a CAGR of 5.6% through 2035. Growth in this segment remains comparatively moderate as larger-scale FLNG projects benefit from stronger economies of scale and lower per-unit liquefaction costs. However, small-scale systems continue to play an essential role in monetizing marginal offshore fields, remote island grids, and underdeveloped basins where large infrastructure is not economically feasible, ensuring steady but niche adoption.
North America FLNG Market accounted for 11% share in 2025 and is projected to grow at a CAGR of 13.8% through 2035. The region's expansion is primarily driven by rising LNG export capacity and the development of offshore-linked liquefaction initiatives along key coastal hubs. Strong project pipelines and increasing integration into global LNG supply routes are reinforcing the region's strategic importance in the FLNG ecosystem.
Major players operating in the FLNG industry are Excelerate Energy, Hoegh Evi, Technip Energies, Samsung Heavy Industries, Golar LNG, Seatrium, HD Hyundai Heavy Industries, New Fortress Energy, BW LNG, JGC Holdings Corporation, Baker Hughes, McDermott International, Wison Offshore & Marine, SBM Offshore, MISC Berhad, Exmar, MOL, UTM Offshore, Delfin Midstream, and Air Products. Companies operating in the FLNG market are increasingly focusing on modular engineering approaches, vessel conversion strategies, and standardized liquefaction train designs to reduce capital expenditure and shorten project timelines. They are also investing heavily in digitalization, including AI-driven predictive maintenance systems and digital twin platforms, to improve asset reliability and minimize downtime across offshore operations. Strategic collaborations between EPC contractors, energy majors, and marine engineering firms are strengthened to secure long-term project pipelines and share technological risk. In addition, firms are expanding into floating regasification and hybrid FLNG-FSRU solutions to diversify revenue streams and improve asset utilization rates.
Table of Contents
Chapter 1 Methodology & Scope
- 1.1 Research approach
- 1.2 Quality commitments
- 1.2.1 GMI AI policy & data integrity commitment
- 1.2.1.1 Source consistency protocol
- 1.2.1 GMI AI policy & data integrity commitment
- 1.3 Research trail & confidence scoring
- 1.3.1 Research trail components
- 1.3.2 Scoring components
- 1.4 Data collection
- 1.4.1 Partial list of primary sources
- 1.5 Data mining sources
- 1.5.1 Paid sources
- 1.5.1.1 Sources, by region
- 1.5.1 Paid sources
- 1.6 Base estimates and calculations
- 1.6.1 Base year calculation for any one approach
- 1.7 Market estimates & forecasts parameters
- 1.8 Forecast model
- 1.8.1 Quantified market impact analysis
- 1.8.1.1 Mathematical impact of growth parameters on forecast
- 1.8.1 Quantified market impact analysis
- 1.9 Research transparency addendum
- 1.9.1 Source attribution framework
- 1.9.2 Quality assurance metrics
- 1.9.3 Our commitment to trust
- 1.10 Market definitions
Chapter 2 Executive Summary
- 2.1 Industry synopsis, 2022 - 2035
- 2.1.1 Business trends
- 2.1.2 Facility trends
- 2.1.3 Capacity trends
- 2.1.4 Application trends
- 2.1.5 Regional trends
Chapter 3 Industry Insights
- 3.1 Industry ecosystem analysis
- 3.1.1 Shipyard capacity & bottlenecks
- 3.1.2 Cryogenic equipment sourcing & long lead-time components
- 3.1.3 Skilled labor supply & workforce constraints in module fabrication yards
- 3.2 Regulatory landscape
- 3.3 Industry impact forces
- 3.3.1 Growth drivers
- 3.3.2 Industry pitfalls & challenges
- 3.4 Growth potential analysis
- 3.5 Porter's analysis
- 3.5.1 Bargaining power of suppliers
- 3.5.2 Bargaining power of buyers
- 3.5.3 Threat of new entrants
- 3.5.4 Threat of substitutes
- 3.6 PESTEL analysis
- 3.6.1 Political factors
- 3.6.2 Economic factors
- 3.6.3 Social factors
- 3.6.4 Technological factors
- 3.6.5 Legal factors
- 3.6.6 Environmental factors
- 3.7 Investment & funding analysis
- 3.7.1 Capital expenditure trends in FLNG projects
- 3.7.2 Capital investment trends in small-scale LNG infrastructure
- 3.7.3 Private Equity, NOC & multilateral Funding Landscape
- 3.8 Price trend analysis (Driven by Primary Research)
- 3.8.1 Historical price trend analysis
- 3.9 Impact of AI & Generative AI on the market
- 3.9.1 AI-Driven disruption of existing business models
- 3.9.2 GenAI use cases & adoption roadmap
- 3.9.3 Risks, limitations & regulatory considerations
- 3.10 Sustainability initiatives & industry 4.0 integration
- 3.11 Future outlook & strategic opportunities
- 3.12 Capacity landscape (Driven by Primary Research)
- 3.12.1 Installed FLNG Capacity
- 3.12.2 Capacity Utilization Rates & Expansion Pipelines
Chapter 4 Competitive Landscape, 2026
- 4.1 Introduction
- 4.2 Company market share analysis, by region, 2025
- 4.2.1 North America
- 4.2.2 Europe
- 4.2.3 Asia Pacific
- 4.2.4 Middle East & Africa
- 4.2.5 Latin America
- 4.3 Key developments
- 4.3.1 Key partnerships & collaborations
- 4.3.2 Major M&A activities
- 4.3.3 Product innovations & launches
- 4.3.4 Market expansion strategies
- 4.4 Competitive positioning matrix
- 4.4.1 Tier classification criteria & qualifying thresholds
- 4.4.2 Tier positioning matrix by revenue, geography & innovation
Chapter 5 Market Size and Forecast, By Facility, 2022 - 2035 (MTPA & USD Million)
- 5.1 Key trends
- 5.2 FSRU
- 5.3 LNG FPSO
- 5.4 Barge-Based FLNG
Chapter 6 Market Size and Forecast, By Capacity, 2022 - 2035 (MTPA & USD Million)
- 6.1 Key trends
- 6.2 Small Scale
- 6.3 Med Scale
- 6.4 Large Scale
Chapter 7 Market Size and Forecast, By Application, 2022 - 2035 (MTPA & USD Million)
- 7.1 Key trends
- 7.2 Liquefaction & Production
- 7.3 Regasification
- 7.4 Storage & Transportation
Chapter 8 Market Size and Forecast, By Region, 2022 - 2035 (MTPA & USD Million)
- 8.1 Key trends
- 8.2 North America
- 8.2.1 U.S.
- 8.2.2 Canada
- 8.2.3 Mexico
- 8.3 Europe
- 8.3.1 UK
- 8.3.2 Norway
- 8.3.3 Netherlands
- 8.4 Asia Pacific
- 8.4.1 China
- 8.4.2 Australia
- 8.4.3 Indonesia
- 8.4.4 Malaysia
- 8.5 Middle East & Africa
- 8.5.1 Qatar
- 8.5.2 UAE
- 8.5.3 Mozambique
- 8.5.4 Senegal
- 8.5.5 Republic of Congo
- 8.5.6 Gabon
- 8.5.7 Mauritania
- 8.6 Latin America
- 8.6.1 Brazil
- 8.6.2 Argentina
- 8.6.3 Chile
Chapter 9 Company Profiles
- 9.1 BW LNG
- 9.2 Baker Hughes
- 9.3 Delfin Midstream
- 9.4 Excelerate Energy
- 9.5 Exmar NV
- 9.6 Golar LNG Limited
- 9.7 Hoegh Evi
- 9.8 HD Hyundai Heavy Industries
- 9.9 JGC Holdings
- 9.10 MISC Berhad
- 9.11 MOL (Mitsui O.S.K. Lines)
- 9.12 McDermott International
- 9.13 New Fortress Energy
- 9.14 Samsung Heavy Industries
- 9.15 SBM Offshore
- 9.16 Seatrium
- 9.17 Technip Energies
- 9.18 UTM Offshore
- 9.19 Wison Offshore & Marine

