
PUBLISHER: Mordor Intelligence | PRODUCT CODE: 2062467

PUBLISHER: Mordor Intelligence | PRODUCT CODE: 2062467
Floating Liquefied Natural Gas - Market Share Analysis, Industry Trends & Statistics, Growth Forecasts (2026 - 2031)
According to Mordor Intelligence, the floating liquefied natural gas market size is projected to be USD 25.57 billion in 2025, USD 28.20 billion in 2026, and reach USD 44.72 billion by 2031, growing at a CAGR of 9.66% from 2026 to 2031.
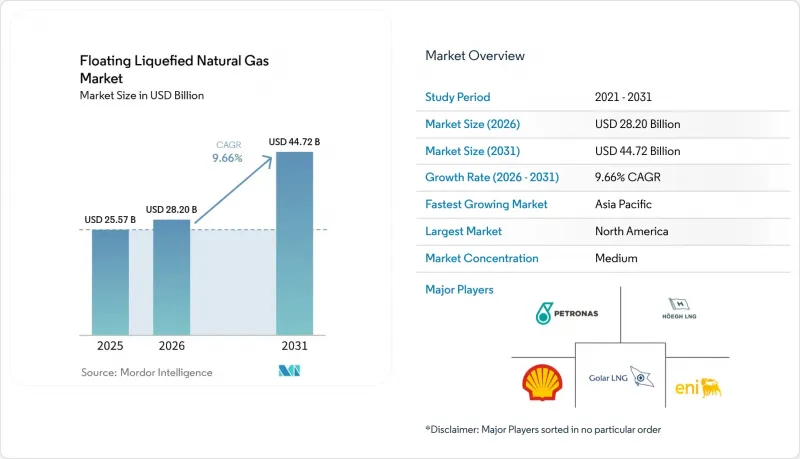
This report is Segmented by Capacity (Small-Scale, Medium-Scale, and Large-Scale), Deployment Type (Offshore and Near-Shore), Application (Liquefaction, Regasification, and Storage and Transportation), and Geography (North America, Europe, Asia-Pacific, South America, and Middle East and Africa). The Market Sizes and Forecasts are Provided in Terms of Value (USD).
Global Floating Liquefied Natural Gas Market Trends and Insights
Gas-Demand Surge from Coal-to-Gas Switching in Asia
Natural-gas consumption in Asia is projected to rise 5% annually through 2030, creating an outsized call on flexible LNG supply. FLNG units offer Asian buyers strategic diversification beyond pipelines and long-haul cargoes by delivering gas directly from offshore sources to shore without extensive onshore terminals. Their mobility allows re-deployment to new demand nodes as industrial clusters migrate inland. Smaller Asian economies also favor FLNG when conventional import terminals face financing obstacles or land-use opposition, making floating infrastructure a bridge toward lower-emission energy targets. Large-scale deployments near China's eastern seaboard are complemented by modular units in the Philippines and Vietnam, where grid stability needs quick-turn LNG. The region's importers are set to absorb 70% of incremental global LNG by 2030, solidifying Asia's influence over FLNG market dynamics.
European Energy-Security Push Post-Russia Conflict
European LNG imports climbed to 143 bcm in 2025 on the REPowerEU requirement for 90 days of winter coverage. Germany commissioned four FSRUs that now liquefy and re-export excess volumes, letting buyers across Poland and the Czech Republic tap floating capacity without new pipelines. National Grid UK is locked in a fifteen-year capacity for three North Sea nearshore FLNG projects to reverse domestic import reliance. Destination-clause acceptance by European offtakers signals a structural shift that underpins the Floating Liquefied Natural Gas market's long-term visibility. All assets must now pass IEC 62443 cybersecurity certification, lifting technical barriers to entry for new contractors.
High CAPEX And Financing Risk Profile
Prelude's final bill reached USD 17 billion, double its sanction estimate, after corrosion issues forced re-work. Mozambique LNG's 2021 suspension stranded USD 23 billion, making lenders wary of adjacent FLNG without sovereign guarantees. Commercial banks now demand 1.4X debt-service coverage, achievable only with long-term oil-linked contracts above USD 60 Brent. Japanese and Korean export-credit agencies supplied USD 6.8 billion of guarantees in 2025, but sub-BB-sovereigns were ineligible, excluding 40% of frontier prospects. Tolling agreements curb price risk for owners yet expose them to volume risk if reservoirs underperform, pressuring cash flows in the Floating Liquefied Natural Gas market.
Other drivers and restraints analyzed in the detailed report include:
- Cost Competitiveness of FLNG versus On-Shore LNG
- Faster Time-to-Market for Stranded Offshore Gas Fields
- LNG Price-Cycle Volatility Delaying FIDs
For complete list of drivers and restraints, kindly check the Table Of Contents.
Segment Analysis
Large-scale platforms above 3 million tpa secured 56.2% of the Floating Liquefied Natural Gas market share in 2025. High throughput spreads hull amortization across more cargoes, anchoring the Floating Liquefied Natural Gas market size advantage that majors wield when negotiating long-term contracts. Prelude, PFLNG Dua, and Coral Sul together loaded 11.7 million tonnes in 2025, capturing Asian premiums of USD 0.80 /MMBtu over Henry Hub-linked supply. Yet the steep capital bill and charter lock-ins spur interest in medium-scale units that can relocate as reservoirs deplete. Golar's conversion model delivers such flexibility by repurposing mid-life carriers, slicing build time to 38 months, and offering operators an option to redeploy toward fresh gas hubs as regional demand pivots, strengthening the resilience of the Floating Liquefied Natural Gas market.
Medium-scale assets between 1 and 3 million tpa are expanding, where 200-meter depths let jack-up rigs perform maintenance, trimming offshore labor by 22%. Small-scale units under 1 million tpa cater to emerging e-methanol bunkering and island grids. Hyundai's 0.6-million-tpa standard design costs USD 480 million, 40% cheaper per tonne than custom mega-hulls. Classification societies now require dual-fuel propulsion on units above 2.5 million tpa, adding USD 180 million but unlocking EU Taxonomy financing. As digital twins optimize production uptime, capacity choice is shifting from a pure economies-of-scale decision toward a portfolio-risk calculus that balances utilization, redeployment agility, and compliance costs within the Floating Liquefied Natural Gas market.
Geography Analysis
North America anchored 33.9% of global revenue in 2025 as U.S. Gulf Coast producers leveraged Henry Hub feedgas priced USD 3.20 below Asian spot benchmarks, underpinning competitive delivered costs to Tokyo. New Fortress Energy's Fast LNG loaded 1.4 million t in its first full year and aims to replicate the design for three more Gulf platforms. A January 2026 British Columbia proposal seeks to ship Montney shale gas to Japan under 15-year JKM-indexed deals. Mexico is weighing nearshore units to liquefy associated gas in the Bay of Campeche, cutting flaring that hit 18 bcm in 2024.
Asia-Pacific is the fastest-growing Floating Liquefied Natural Gas market, expanding at 11.3% through 2031, with Australia, Indonesia, and Malaysia sanctioning 7.8 million tpa in 2025. Woodside's Browse FLNG will deploy a 3.5-million-tpa platform by 2029 after land opposition stalled the original onshore plan. Indonesia granted four FLNG licenses across the Natuna and Masela fields to serve its archipelago's dispersed power demand. Malaysia is constructing a third PFLNG that expects an 18% capex-per-tonne saving through modularization. India's ONGC is engineering a 1.8-million-tpa vessel for the Krishna-Godavari Basin to displace spot cargo imports priced at USD 12 /MMBtu.
Europe's share remains modest yet strategically important as floating regas hubs backfill Russian pipeline deficits. National Grid UK awarded 15-year contracts to three North Sea nearshore projects that will liquefy domestic gas for export to continental buyers by 2029. Germany's quartet of FSRUs functions as seasonal bidirectional hubs, exporting to Poland and the Czech Republic during shoulder months. Nordic ports are piloting small-scale FLNG for e-methanol bunkering, with a 0.8-million-tpa unit slated for Norway. Spain and France unlocked interconnector access parity for floating operators in March 2025 under the revised EU Gas Directive, widening arbitrage prospects. Sanctions continue to delay Russia's two planned Arctic FLNG units, deferring 6.6 million tpa until after 2028.
- Shell
- Petronas
- Golar LNG
- ExxonMobil
- Eni SpA
- Hoegh LNG
- Technip Energies
- Samsung Heavy Industries
- Hyundai Heavy Industries
- KBR
- JGC Corporation
- SBM Offshore
- BW Offshore
- MODEC
- TotalEnergies
- Chevron
- BP
- Mitsui OSK Lines
- New Fortress Energy
- Delfin Midstream
- Karoon Energy
- ENH Mozambique
Additional Benefits:
- The market estimate (ME) sheet in Excel format
- 3 months of analyst support
TABLE OF CONTENTS
1 Introduction
- 1.1 Study Assumptions & Market Definition
- 1.2 Scope of the Study
2 Research Methodology
3 Executive Summary
4 Market Landscape
- 4.1 Market Overview
- 4.2 Market Drivers
- 4.2.1 Gas-demand surge from coal-to-gas switching in Asia
- 4.2.2 European energy-security push post-Russia conflict
- 4.2.3 Cost competitiveness of FLNG versus on-shore LNG
- 4.2.4 Faster time-to-market for stranded offshore gas fields
- 4.2.5 AI & data-center induced coastal LNG power demand
- 4.2.6 Small-scale FLNG for e-methanol shipping fuels
- 4.3 Market Restraints
- 4.3.1 High CAPEX & financing risk profile
- 4.3.2 LNG price-cycle volatility delaying FIDs
- 4.3.3 Tightening methane-slip regulation on floating assets
- 4.3.4 Skilled-labour shortages in cryogenic module yards
- 4.4 Supply-Chain Analysis
- 4.5 Regulatory Landscape
- 4.6 Technological Outlook
- 4.7 Porters Five Forces
- 4.7.1 Threat of New Entrants
- 4.7.2 Bargaining Power of Suppliers
- 4.7.3 Bargaining Power of Buyers
- 4.7.4 Threat of Substitutes
- 4.7.5 Competitive Rivalry
- 4.8 Investment & Project Analysis
- 4.8.1 Key FLNG Projects - Operational
- 4.8.2 Key FLNG Projects - Under Construction
- 4.8.3 Key FLNG Projects - Planned / Announced
- 4.8.4 Project Economics & Feasibility
- 4.8.5 Joint-Ventures & Partnerships
5 Market Size & Growth Forecasts
- 5.1 By Capacity
- 5.1.1 Small-Scale (Below 1 MTPA)
- 5.1.2 Medium-Scale (1 to 3 MTPA)
- 5.1.3 Large-Scale (Above 3 MTPA)
- 5.2 By Deployment Type
- 5.2.1 Offshore
- 5.2.2 Near-shore
- 5.3 By Application
- 5.3.1 Liquefaction
- 5.3.2 Regasification
- 5.3.3 Storage and Transportation
- 5.4 By Geography
- 5.4.1 North America
- 5.4.1.1 United States
- 5.4.1.2 Canada
- 5.4.1.3 Mexico
- 5.4.2 Europe
- 5.4.2.1 United Kingdom
- 5.4.2.2 Germany
- 5.4.2.3 France
- 5.4.2.4 Spain
- 5.4.2.5 Nordic Countries
- 5.4.2.6 Russia
- 5.4.2.7 Rest of Europe
- 5.4.3 Asia-Pacific
- 5.4.3.1 China
- 5.4.3.2 India
- 5.4.3.3 Japan
- 5.4.3.4 South Korea
- 5.4.3.5 ASEAN Countries
- 5.4.3.6 Australia and New Zealand
- 5.4.3.7 Rest of Asia-Pacific
- 5.4.4 South America
- 5.4.4.1 Brazil
- 5.4.4.2 Argentina
- 5.4.4.3 Colombia
- 5.4.4.4 Rest of South America
- 5.4.5 Middle East and Africa
- 5.4.5.1 United Arab Emirates
- 5.4.5.2 Saudi Arabia
- 5.4.5.3 South Africa
- 5.4.5.4 Egypt
- 5.4.5.5 Rest of Middle East and Africa
- 5.4.1 North America
6 Competitive Landscape
- 6.1 Market Concentration
- 6.2 Strategic Moves (M&A, Partnerships, PPAs)
- 6.3 Market Share Analysis (Market Rank/Share for key companies)
- 6.4 Company Profiles (includes Global level Overview, Market level overview, Core Segments, Financials as available, Strategic Information, Products & Services, and Recent Developments)
- 6.4.1 Shell
- 6.4.2 Petronas
- 6.4.3 Golar LNG
- 6.4.4 ExxonMobil
- 6.4.5 Eni SpA
- 6.4.6 Hoegh LNG
- 6.4.7 Technip Energies
- 6.4.8 Samsung Heavy Industries
- 6.4.9 Hyundai Heavy Industries
- 6.4.10 KBR
- 6.4.11 JGC Corporation
- 6.4.12 SBM Offshore
- 6.4.13 BW Offshore
- 6.4.14 MODEC
- 6.4.15 TotalEnergies
- 6.4.16 Chevron
- 6.4.17 BP
- 6.4.18 Mitsui OSK Lines
- 6.4.19 New Fortress Energy
- 6.4.20 Delfin Midstream
- 6.4.21 Karoon Energy
- 6.4.22 ENH Mozambique
7 Market Opportunities & Future Outlook
- 7.1 White-space & Unmet-Need Assessment

