PUBLISHER: Global Market Insights Inc. | PRODUCT CODE: 2101940

PUBLISHER: Global Market Insights Inc. | PRODUCT CODE: 2101940
Securities Brokerage Market Opportunity, Growth Drivers, Industry Trend Analysis, and Forecast 2026 - 2035
The Global Securities Brokerage Market was valued at USD 1.74 trillion in 2025 and is estimated to grow at a CAGR of 7.8% to reach USD 3.64 trillion by 2035.
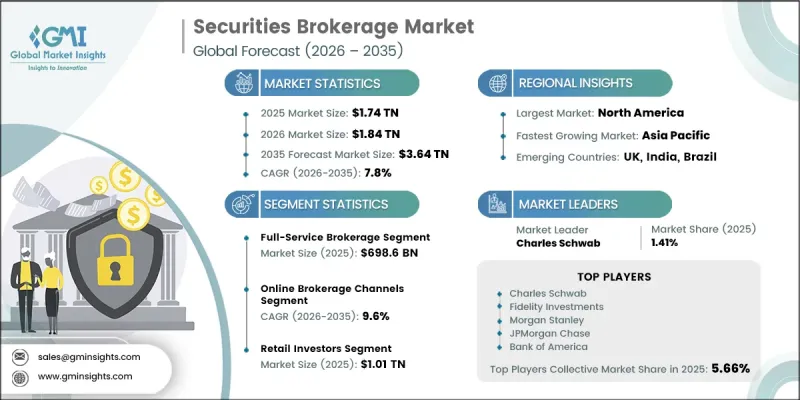
The industry is evolving beyond traditional transaction-based revenue models as brokerage firms increasingly focus on digital accessibility, execution efficiency, customer engagement, cash management, advisory services, and broader investment platforms. Rising participation from retail investors is expanding the overall customer base, while institutional clients continue demanding more sophisticated execution capabilities, advanced analytics, and seamless access to multiple asset classes. The growing popularity of low-cost investment solutions and commission-free trading is estimated to contribute approximately 1.8 percentage points to overall market growth. At the same time, brokerage firms are diversifying revenue through margin lending, cash management solutions, premium research, and advisory services rather than relying solely on trading commissions. Artificial intelligence and algorithm-driven technologies are becoming increasingly important for improving trade execution, client personalization, fraud detection, compliance monitoring, and operational efficiency. Continued investment in advanced digital infrastructure and intelligent automation is expected to support long-term expansion across the global securities brokerage market.
| Market Scope | |
|---|---|
| Start Year | 2025 |
| Forecast Year | 2026-2035 |
| Start Value | $1.74 Trillion |
| Forecast Value | $3.64 Trillion |
| CAGR | 7.8% |
The securities brokerage market continues to benefit from increasing adoption of artificial intelligence within core brokerage operations. Financial institutions are utilizing machine learning technologies to improve order routing, execution quality, transaction monitoring, fraud prevention, and personalized client experiences. Growing regulatory expectations surrounding best execution and transparent trade monitoring are also encouraging brokerage firms to strengthen technology investments. Primary research conducted during the first quarter of 2026 involving 42 brokerage technology and execution executives across multiple international markets indicated that artificial intelligence-based execution tools and customer personalization technologies remain priority investment areas despite ongoing pressure on commission-based revenue.
Full-service brokerage accounted for USD 698.6 billion in 2025, representing 40.1% share. The segment is projected to grow at a CAGR of 5.1% and reach USD 1.13 trillion by 2035. Its leadership is supported by strong demand for integrated financial services that combine investment advisory, portfolio management, research, custody, lending, and trade execution within a single client relationship. Continued demand from institutional investors and high-value clients seeking comprehensive wealth management solutions is expected to sustain long-term segment growth.
The online brokerage channels generated USD 1.25 trillion in 2025, accounting for 72.1% share, and is forecast to reach USD 3.08 trillion by 2035 while growing at a CAGR of 9.6%. Growth in this segment is driven by widespread digital adoption, increasing smartphone usage, cloud-based trading infrastructure, application programming interface connectivity, and integrated financial services. Online platforms also improve operational efficiency by reducing dependence on physical branches while streamlining customer onboarding, digital verification, compliance processes, and ongoing account management.
North America Securities Brokerage Market generated USD 837.8 billion in 2025, representing 46.8% share. Market growth is supported by a highly developed financial ecosystem, broad participation across investment products, expanding wealth management services, and continued adoption of digital brokerage platforms. Ongoing innovation in online investing, together with increasing participation from retail and institutional investors, continues to reinforce North America's leadership in the global securities brokerage market.
Major companies operating in the global securities brokerage market include Charles Schwab, Fidelity Investments, Morgan Stanley, JPMorgan Chase & Co., Bank of America, Interactive Brokers, Robinhood Markets, Goldman Sachs, UBS, and StoneX. Companies operating in the securities brokerage market are strengthening their competitive position by expanding digital investment platforms, enhancing mobile trading capabilities, and investing in artificial intelligence to improve execution quality and customer experience. Firms continue allocating resources toward technology modernization, cybersecurity, and advanced analytics to increase operational efficiency and regulatory compliance. Many organizations are broadening their product portfolios by integrating advisory services, wealth management, cash management, and margin lending solutions to diversify revenue streams. Strategic partnerships, platform enhancements, and continuous innovation help improve customer acquisition and retention.
Table of Contents
Chapter 1 Methodology & Scope
- 1.1 Research approach
- 1.2 Quality Commitments
- 1.2.1 GMI AI policy & data integrity commitment
- 1.2.1.1 Source consistency protocol
- 1.2.1 GMI AI policy & data integrity commitment
- 1.3 Research Trail & Confidence Scoring
- 1.3.1 Research Trail Components
- 1.3.2 Scoring Components
- 1.4 Data Collection
- 1.4.1 Partial list of primary sources
- 1.5 Data mining sources
- 1.5.1 Paid sources
- 1.5.1.1 Sources, by region
- 1.5.1 Paid sources
- 1.6 Base estimates and calculations
- 1.6.1 Base year calculation
- 1.7 Forecast
- 1.7.1 Quantified market impact analysis
- 1.7.1.1 Mathematical impact of growth parameters on forecast
- 1.7.1 Quantified market impact analysis
- 1.8 Research transparency addendum
- 1.8.1 Source attribution framework
- 1.8.2 Quality assurance metrics
- 1.8.3 Our commitment to trust
Chapter 2 Executive Summary
- 2.1 Industry 360° synopsis
- 2.2 Key market trends
- 2.2.1 Regional
- 2.2.2 Brokerage Model
- 2.2.3 Asset Class
- 2.2.4 Mode
- 2.2.5 Service Type
- 2.2.6 End User
- 2.3 TAM Analysis, 2026-2035
- 2.4 CXO perspectives: Strategic imperatives
Chapter 3 Industry Insights
- 3.1 Industry ecosystem analysis
- 3.1.1 Supplier landscape
- 3.1.1.1 Raw material suppliers
- 3.1.1.2 Component suppliers
- 3.1.1.3 Manufacturers
- 3.1.1.4 Service providers
- 3.1.1.5 Distribution channel
- 3.1.1.6 End Use
- 3.1.2 Cost structure
- 3.1.3 Profit margin
- 3.1.4 Value addition at each stage
- 3.1.5 Vertical integration trends
- 3.1.6 Disruptors
- 3.1.1 Supplier landscape
- 3.2 Industry impact forces
- 3.2.1 Growth drivers
- 3.2.1.1 Rising global participation in equity and capital markets by retail and institutional investors.
- 3.2.1.2 Increasing digitalization of brokerage services through cloud, mobile, and API-based trading platforms.
- 3.2.1.3 Growing demand for low-cost, self-directed investment solutions and commission-free trading.
- 3.2.1.4 Expansion of financial literacy initiatives and favorable regulatory reforms supporting capital market participation.
- 3.2.2 Market Restraints
- 3.2.2.1 Rising cybersecurity risks and stricter data privacy regulations affecting digital brokerage platforms.
- 3.2.2.2 Intense fee competition and commission compression reducing profitability among brokerage firms.
- 3.2.3 Market Opportunities
- 3.2.3.1 AI-powered and algorithmic trading platform adoption
- 3.2.3.2 Mobile-first brokerage expansion among younger and emerging-market investors
- 3.2.3.3 Robo-advisory and hybrid wealth management integration
- 3.2.3.4 Multi-asset platform convergence and product suite expansion
- 3.2.1 Growth drivers
- 3.3 Growth potential analysis
- 3.4 Pricing Analysis (Driven by Primary Research)
- 3.4.1 Historical Price Trend Analysis
- 3.4.2 Pricing Strategy by Player Type (Premium / Value / Cost-plus)
- 3.5 Regulatory landscape
- 3.5.1 International
- 3.5.1.1 IOSCO Principles of Securities Regulation
- 3.5.2 Regional
- 3.5.2.1 North America
- 3.5.2.1.1 U.S. Securities Exchange Act of 1934 & FINRA Rules
- 3.5.2.1 North America
- 3.5.3 Europe
- 3.5.3.1 Markets in Financial Instruments Directive II (MiFID II) & Markets in Financial Instruments Regulation (MiFIR)
- 3.5.4 Asia-Pacific
- 3.5.4.1 Japan Financial Instruments and Exchange Act (FIEA)
- 3.5.5 Latin America
- 3.5.5.1 Brazil Securities and Exchange Commission (CVM) Capital Markets Regulations
- 3.5.6 Middle East & Africa
- 3.5.6.1 Saudi Capital Market Authority (CMA) Securities Business Regulations
- 3.5.1 International
- 3.6 Technology and Innovation landscape
- 3.6.1 Current technologies
- 3.6.2 Emerging technologies
- 3.7 Porter's analysis
- 3.8 PESTEL analysis
- 3.9 Patent analysis (Driven by Primary Research)
- 3.10 Impact of AI & generative AI on the market
- 3.10.1 AI-Driven Disruption of Existing Business Models
- 3.10.2 Automated design optimization
- 3.10.3 Supply chain AI for demand forecasting
- 3.10.4 GenAI use cases & adoption roadmap by segment
- 3.10.5 Risks, Limitations & Regulatory Considerations
- 3.11 Sustainability and environmental aspects
- 3.11.1 Sustainable practices
- 3.11.2 Waste reduction strategies
- 3.11.3 Energy efficiency in production
- 3.11.4 Eco-friendly Initiatives
- 3.11.5 Carbon footprint considerations
- 3.12 Forecast assumptions & scenario analysis (Driven by Primary Research)
- 3.12.1 Base Case - key macro & industry variables driving CAGR
- 3.12.2 Optimistic Scenarios - Favorable Macro and Industry Tailwinds
- 3.12.3 Pessimistic Scenario - Macroeconomic slowdown or industry headwinds
Chapter 4 Competitive Landscape, 2025
- 4.1 Introduction
- 4.2 Company market share analysis
- 4.2.1 North America
- 4.2.2 Europe
- 4.2.3 Asia-Pacific
- 4.2.4 Latin America
- 4.2.5 Middle East & Africa
- 4.3 Competitive positioning matrix
- 4.4 Key developments
- 4.4.1 Mergers & acquisitions
- 4.4.2 Partnerships & collaborations
- 4.4.3 New product launches
- 4.4.4 Expansion plans and funding
- 4.5 Company tier benchmarking
- 4.5.1 Tier classification criteria & qualifying thresholds
- 4.5.2 Tier positioning matrix by revenue, geography & innovation
Chapter 5 Market Estimates & Forecast, By Brokerage Model, 2022 - 2035 ($Mn)
- 5.1 Key trends
- 5.2 Full-Service Brokerage
- 5.3 Discount Brokerage
- 5.4 Online/Digital Brokerage
- 5.5 Robo-Advisory Brokerage
Chapter 6 Market Estimates & Forecast, By Asset Class, 2022 - 2035 ($Mn)
- 6.1 Key trends
- 6.2 Equities Brokerage
- 6.3 Fixed Income
- 6.4 Derivatives & Commodities Brokerage
- 6.5 Others
Chapter 7 Market Estimates & Forecast, By Mode, 2022 - 2035 ($Mn)
- 7.1 Key trends
- 7.2 Online
- 7.3 Offline
Chapter 8 Market Estimates & Forecast, By Service Type, 2022 - 2035 ($Mn)
- 8.1 Key trends
- 8.2 Order Execution Services
- 8.3 Advisory & Wealth Management Services
- 8.4 Discretionary Portfolio Management
- 8.5 Clearing & Settlement Services
- 8.6 Research & Data Services
Chapter 9 Market Estimates & Forecast, By End User, 2022 - 2035 ($Mn)
- 9.1 Key trends
- 9.2 Retail Investors
- 9.3 Institutional Investors
Chapter 10 Market Estimates & Forecast, By Region, 2022 - 2035 ($Mn)
- 10.1 North America
- 10.1.1 US
- 10.1.2 Canada
- 10.2 Europe
- 10.2.1 UK
- 10.2.2 Germany
- 10.2.3 France
- 10.2.4 Italy
- 10.2.5 Spain
- 10.2.6 Belgium
- 10.2.7 Netherlands
- 10.2.8 Sweden
- 10.2.9 Russia
- 10.3 Asia Pacific
- 10.3.1 China
- 10.3.2 India
- 10.3.3 Japan
- 10.3.4 Australia
- 10.3.5 Singapore
- 10.3.6 South Korea
- 10.3.7 Vietnam
- 10.3.8 Indonesia
- 10.3.9 Thailand
- 10.4 Latin America
- 10.4.1 Brazil
- 10.4.2 Mexico
- 10.4.3 Argentina
- 10.5 MEA
- 10.5.1 South Africa
- 10.5.2 Saudi Arabia
- 10.5.3 UAE
Chapter 11 Company Profiles
- 11.1 Global Players
- 11.1.1 Charles Schwab
- 11.1.2 Fidelity Investments
- 11.1.3 Morgan Stanley
- 11.1.4 JPMorgan Chase & Co.
- 11.1.5 Bank of America
- 11.1.6 Interactive Brokers
- 11.1.7 Robinhood Markets
- 11.1.8 Goldman Sachs
- 11.1.9 UBS
- 11.1.10 StoneX
- 11.2 Regional Players
- 11.2.1 Zerodha Broking
- 11.2.2 XTB
- 11.2.3 Mirae Asset Securities
- 11.2.4 EFG Holding
- 11.2.5 Itau Corretora de Valores
- 11.2.6 Hargreaves Lansdown
- 11.2.7 Saxo Bank
- 11.2.8 Rakuten Securities
- 11.2.9 Betterment
- 11.2.10 Piper Sandler

