PUBLISHER: Global Market Insights Inc. | PRODUCT CODE: 2109154

PUBLISHER: Global Market Insights Inc. | PRODUCT CODE: 2109154
Small Scale LNG Market Opportunity, Growth Drivers, Industry Trend Analysis, and Forecast 2026 - 2035
The Global Small Scale LNG Market was valued at USD 12.2 billion in 2025 and is estimated to grow at a CAGR of 7.5% to reach USD 25.7 billion by 2035.
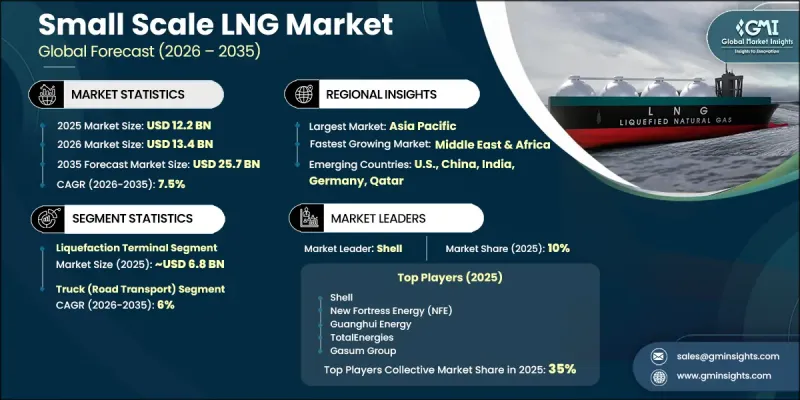
The small scale LNG industry is experiencing steady growth as demand increases for flexible and decentralized natural gas supply solutions across transportation, industrial operations, and power generation applications. Market expansion is supported by stricter environmental regulations, continued development of LNG bunkering infrastructure, and rising demand for reliable energy supplies in regions with limited pipeline connectivity. The transition from conventional liquid fuels to small-scale LNG is being encouraged by its favorable operating economics and the growing emphasis on lowering emissions across multiple industries. In many developing and remote markets, small-scale LNG has become an effective alternative for delivering natural gas where traditional pipeline infrastructure is either unavailable or economically impractical. The increasing adoption of virtual pipeline networks, modular regasification technologies, and ISO container-based transportation is extending natural gas accessibility to new end users while expanding the commercial reach of the global small scale LNG market. These factors continue to create favorable long-term growth opportunities and support wider adoption of small-scale LNG solutions across diverse geographic markets.
| Market Scope | |
|---|---|
| Start Year | 2025 |
| Forecast Year | 2026-2035 |
| Start Value | $12.2 Billion |
| Forecast Value | $25.7 Billion |
| CAGR | 7.5% |
The liquefaction terminals segment accounted for 55.9% share in 2025, generating USD 6.8 billion, and is expected to grow at a CAGR of 6.7% through 2035. Liquefaction facilities serve as the production foundation of small-scale LNG supply chains by converting natural gas into liquefied form for transportation, distributed power generation, industrial consumption, and bunkering applications. The growing deployment of modular and mid-scale liquefaction plants continues to strengthen supply capabilities while improving operational flexibility and expanding LNG availability across regional markets.
The truck delivery segment held 40.3% share in 2025 and is projected to grow at a CAGR of 6% through 2035. Cryogenic tanker trucks remain the preferred method for transporting LNG from liquefaction facilities and import terminals to industrial customers, satellite distribution stations, and local gas networks. The continued expansion of road-based LNG logistics infrastructure is improving supply chain efficiency, increasing delivery flexibility, and supporting broader adoption of small-scale LNG across transportation, industrial, and commercial applications.
North America Small Scale LNG Market held 22% share in 2025 and is forecast to grow at a CAGR of 6.4% through 2035. Regional market growth is supported by abundant domestic natural gas resources, favorable feedstock availability, and increasing investments in liquefaction infrastructure serving transportation and industrial demand. Continued development of LNG distribution networks and expanding commercial adoption of LNG as an alternative fuel are strengthening regional market growth while improving the availability of decentralized natural gas supply solutions across multiple end-use industries.
Major companies operating in the global small scale LNG market include Shell plc, TotalEnergies, Linde, Engie, Honeywell International, Sempra Infrastructure Partners, Gasum, Hoegh LNG Holdings, Excelerate Energy, Pavilion Energy, GAIL (India) Limited, Stabilis Solutions, Galileo Technologies, CryoPur, Cryostar, New Fortress Energy, Eagle LNG Partners, Guanghui Energy, Kunlun Energy, Equinor, Skangas, Snam, ENI, Anthony Veder, Stolt-Nielsen Gas, Pivotal LNG, and Wartsila. Companies operating in the small scale LNG market are strengthening their market position by expanding liquefaction capacity, investing in modular LNG infrastructure, and enhancing distribution networks to improve supply reliability. Manufacturers and service providers are focusing on technological advancements that increase operational efficiency, reduce transportation costs, and support flexible LNG delivery solutions. Strategic partnerships with industrial customers, energy providers, and infrastructure developers are helping companies broaden their market presence and secure long-term supply agreements. Businesses are also investing in virtual pipeline systems, LNG bunkering infrastructure, storage facilities, and regasification technologies to expand geographic coverage and improve customer access.
Table of Contents
Chapter 1 Methodology & Scope
- 1.1 Research approach
- 1.2 Quality commitments
- 1.2.1 GMI AI policy & data integrity commitment
- 1.2.1.1 Source consistency protocol
- 1.2.1 GMI AI policy & data integrity commitment
- 1.3 Research trail & confidence scoring
- 1.3.1 Research trail components
- 1.3.2 Scoring components
- 1.4 Data collection
- 1.4.1 Partial list of primary sources
- 1.5 Data mining sources
- 1.5.1 Paid sources
- 1.5.1.1 Sources, by region
- 1.5.1 Paid sources
- 1.6 Base estimates and calculations
- 1.6.1 Base year calculation for any one approach
- 1.7 Market estimates & forecasts parameters
- 1.8 Forecast model
- 1.8.1 Quantified market impact analysis
- 1.8.1.1 Mathematical impact of growth parameters on forecast
- 1.8.1 Quantified market impact analysis
- 1.9 Research transparency addendum
- 1.9.1 Source attribution framework
- 1.9.2 Quality assurance metrics
- 1.9.3 Our commitment to trust
- 1.10 Market definitions
Chapter 2 Executive Summary
- 2.1 Industry synopsis, 2022 - 2035
- 2.1.1 Business trends
- 2.1.2 Terminal trends
- 2.1.3 Mode of supply trends
- 2.1.4 Application trends
- 2.1.5 End use trends
- 2.1.6 Regional trends
Chapter 3 Industry Insights
- 3.1 Industry ecosystem analysis
- 3.1.1 Feedstock sourcing & gas supply agreements analysis
- 3.1.2 Liquefaction & processing layer
- 3.1.3 Storage, logistics & distribution infrastructure
- 3.1.4 End-use integration & customer analysis
- 3.2 Regulatory landscape
- 3.3 Industry impact forces
- 3.3.1 Growth drivers
- 3.3.2 Industry pitfalls & challenges
- 3.4 Growth potential analysis
- 3.5 Porter's analysis
- 3.5.1 Bargaining power of suppliers
- 3.5.2 Bargaining power of buyers
- 3.5.3 Threat of new entrants
- 3.5.4 Threat of substitutes
- 3.6 PESTEL analysis
- 3.6.1 Political factors
- 3.6.2 Economic factors
- 3.6.3 Social factors
- 3.6.4 Technological factors
- 3.6.5 Legal factors
- 3.6.6 Environmental factors
- 3.7 Investment & funding analysis
- 3.7.1 Capital investment trends in small-scale LNG infrastructure
- 3.7.2 Government grants & subsidies
- 3.8 Trade data analysis (Driven by Primary Research)
- 3.8.1 Lng import & export
- 3.8.2 Key trade corridors
- 3.8.3 Tariff structures & trade policy impact
- 3.9 Impact of AI & Generative AI on the market
- 3.9.1 AI-Driven disruption of existing business models
- 3.9.2 GenAI use cases & adoption roadmap
- 3.9.3 Risks, limitations & regulatory considerations
- 3.10 Sustainability initiatives & industry 4.0 integration
- 3.11 Future outlook & strategic opportunities
- 3.11.1 Market evolution roadmap
- 3.11.2 Emerging applications analysis
- 3.11.3 Technology convergence analysis
Chapter 4 Competitive Landscape, 2026
- 4.1 Introduction
- 4.2 Company market share analysis, by region, 2025
- 4.2.1 North America
- 4.2.2 Europe
- 4.2.3 Asia Pacific
- 4.2.4 Middle East & Africa
- 4.2.5 Latin America
- 4.3 Key developments
- 4.3.1 Key partnerships & collaborations
- 4.3.2 Major M&A activities
- 4.3.3 Product innovations & launches
- 4.3.4 Market expansion strategies
- 4.4 Competitive positioning matrix
- 4.4.1 Tier classification criteria & qualifying thresholds
- 4.4.2 Tier positioning matrix by revenue, geography & innovation
Chapter 5 Market Size and Forecast, By Terminal, 2022 - 2035 (USD Million)
- 5.1 Key trends
- 5.2 Liquefaction terminal
- 5.2.1 Peak-shaving plants
- 5.2.2 Industrial liquefaction units
- 5.2.3 Satellite & modular liquefaction stations
- 5.2.4 Stranded gas monetization liquid facilities
- 5.3 Regasification terminal
- 5.3.1 Satellite Regasification Units (SRUS)
- 5.3.2 Virtual pipeline endpoint regasification station
- 5.3.3 Marine & port regasification facilities
Chapter 6 Market Size and Forecast, By Mode of Supply, 2022 - 2035 (USD Million)
- 6.1 Key trends
- 6.2 Truck (Road Transport)
- 6.3 Trans-shipment & Marine Bunkering
- 6.4 ISO Containers (Multi-Modal)
- 6.5 Virtual Pipeline
- 6.6 Rail Tanks
Chapter 7 Market Size and Forecast, By Application, 2022 - 2035 (USD Million)
- 7.1 Key trends
- 7.2 Transportation
- 7.3 Industrial Feedstock
- 7.4 Power Generation
- 7.5 Marine Bunkering
- 7.6 Others
Chapter 8 Market Size and Forecast, By End Use, 2022 - 2035 (USD Million)
- 8.1 Key trends
- 8.2 Mining & Heavy Industry
- 8.3 Oil & Gas
- 8.4 Utilities & IPPs
- 8.5 Shipping & Marine Operators
- 8.6 Others
Chapter 9 Market Size and Forecast, By Region, 2022 - 2035 (USD Million)
- 9.1 Key trends
- 9.2 North America
- 9.2.1 U.S.
- 9.2.2 Canada
- 9.2.3 Mexico
- 9.3 Europe
- 9.3.1 UK
- 9.3.2 Germany
- 9.3.3 France
- 9.3.4 Spain
- 9.3.5 Norway
- 9.3.6 Italy
- 9.4 Asia Pacific
- 9.4.1 China
- 9.4.2 Japan
- 9.4.3 South Korea
- 9.4.4 India
- 9.4.5 Indonesia
- 9.4.6 Singapore
- 9.4.7 Thailand
- 9.5 Middle East & Africa
- 9.5.1 UAE
- 9.5.2 Saudi Arabia
- 9.5.3 Qatar
- 9.5.4 Turkey
- 9.5.5 South Africa
- 9.5.6 Nigeria
- 9.5.7 Algeria
- 9.6 Latin America
- 9.6.1 Brazil
- 9.6.2 Argentina
Chapter 10 Company Profiles
- 10.1 Shell plc
- 10.2 New Fortress Energy (NFE)
- 10.3 Guanghui Energy
- 10.4 TotalEnergies
- 10.5 Gasum Group
- 10.6 Kunlun Energy (CNOOC)
- 10.7 Equinor
- 10.8 Excelerate Energy
- 10.9 Linde
- 10.10 Engie
- 10.11 Hoegh LNG Holdings
- 10.12 Stabilis Solutions
- 10.13 Galileo Technologies
- 10.14 Snam
- 10.15 GAIL (India) Limited
- 10.16 Pavilion Energy
- 10.17 Sempra Infrastructure
- 10.18 Eagle LNG Partners
- 10.19 Honeywell International
- 10.20 Cryostar
- 10.21 Anthony Veder Group
- 10.22 Stolt-Nielsen
- 10.23 Pivotal LNG
- 10.24 Wartsila

