PUBLISHER: Global Market Insights Inc. | PRODUCT CODE: 2109236

PUBLISHER: Global Market Insights Inc. | PRODUCT CODE: 2109236
North America Wet Scrubbers Market Opportunity, Growth Drivers, Industry Trend Analysis, and Forecast 2026 - 2035
North America Wet Scrubbers Market was valued at USD 3 billion in 2025 and is estimated to grow at a CAGR of 4.8% to reach USD 4.8 billion by 2035.
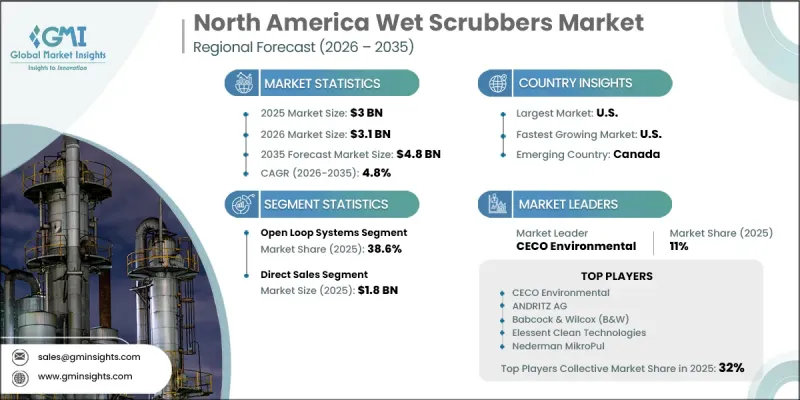
Strong industrial activity, stricter environmental compliance requirements, and the growing emphasis on improving air quality continue to create favorable conditions for market growth across the region. Industries are increasingly investing in advanced emission control technologies to meet evolving environmental standards while maintaining efficient production processes. Wet scrubbers remain a preferred solution because they effectively remove airborne contaminants, improve workplace safety, and support long-term sustainability initiatives. Ongoing modernization of industrial facilities, replacement of aging pollution control equipment, and continuous investments in cleaner manufacturing processes are further supporting product demand. Technological improvements focused on operational efficiency, lower maintenance requirements, and enhanced pollutant removal capabilities are also encouraging wider adoption across multiple industrial sectors.
| Market Scope | |
|---|---|
| Start Year | 2025 |
| Forecast Year | 2026-2035 |
| Start Value | $3 Billion |
| Forecast Value | $4.8 Billion |
| CAGR | 4.8% |
The venturi scrubbers segment captured USD 0.71 billion in 2025. The segment continues to maintain a strong position because of its ability to deliver highly efficient air pollution control across a broad range of industrial operations. Its operating mechanism enables intensive interaction between contaminated gas streams and the scrubbing liquid, resulting in effective removal of fine particles as well as various gaseous pollutants. The technology is widely recognized for delivering consistent performance under demanding operating conditions while supporting compliance with increasingly stringent emission regulations. Industries also value venturi scrubbers for their operational reliability, high collection efficiency, and compatibility with facilities handling large process volumes.
The open-loop systems segment accounted for 38.6% share in 2025. The segment continues to lead because it offers an effective and practical solution for facilities where water availability supports continuous scrubbing operations. These systems remain widely utilized due to their straightforward operating design, dependable pollutant removal capabilities, and ability to accommodate large industrial processing requirements. Their established presence across multiple industrial environments reflects years of operational acceptance and compatibility with existing environmental compliance practices. Companies continue to favor open loop systems because they provide stable performance, relatively simple maintenance procedures, and cost-effective operation over extended service periods. requirements.
United States Wet Scrubbers Market held 86.8% share in 2025 and generated USD 2.6 billion. The country continues to dominate the regional market because it possesses the largest industrial manufacturing base and one of the most comprehensive environmental regulatory systems across North America. Strong industrial output, ongoing investments in facility modernization, and continuous upgrades to emission control infrastructure continue to create significant demand for wet scrubber technologies. The presence of numerous manufacturing facilities, energy production operations, and industrial processing plants further supports widespread product adoption. The competitive landscape of the North America wet scrubbers market includes a combination of established global manufacturers, experienced regional suppliers, and emerging companies that continue to expand their industry presence.
Leading global participants include Babcock & Wilcox (B&W), CECO Environmental, Elessent Clean Technologies, ANDRITZ AG, GEA Group AG, Nederman MikroPul, and Valmet Oyj. Regional companies such as Tri-Mer Corporation, Monroe Environmental, ECS Environmental Solutions, Ducon Technologies, Sly Inc., PCC Group / AirPol, and Epcon Industrial Systems maintain strong market visibility by delivering specialized wet scrubbing systems tailored to diverse industrial requirements. The market also includes emerging participants such as Bionomic Industries, Ship & Shore Environmental, Envitech Inc., Pollution Systems Inc., CR Clean Air Group, Viron International, and Pollution Control Products Co. (PPC), which continue expanding their product portfolios and strengthening customer relationships through innovative air pollution control technologies and customized engineering solutions. Companies operating in the North America Wet Scrubbers Market primarily strengthen their market position through continuous product innovation, advanced engineering capabilities, and investments in research and development. Manufacturers focus on improving system efficiency, lowering operating costs, increasing equipment durability, and enhancing emission removal performance to address evolving customer requirements. Strategic collaborations with industrial customers, engineering firms, and environmental solution providers help companies broaden their market reach while supporting customized project execution.
Table of Contents
Chapter 1 Methodology and Scope
- 1.1 Market scope & definitions
- 1.2 Research design
- 1.2.1 Research approach
- 1.2.2 Data collection methods
- 1.3 Base estimates and calculations
- 1.3.1 Base year calculation
- 1.3.2 Market estimates & forecasts parameters
- 1.4 Forecast model
- 1.4.1 Key trends for market estimates
- 1.4.2 Quantified market impact analysis
- 1.4.2.1 Mathematical impact of growth parameters on forecast
- 1.4.3 Scenario analysis framework
- 1.5 Primary research and validation
- 1.5.1 Some of the primary sources (but not limited to)
- 1.6 Data mining sources
- 1.6.1 Paid Sources
- 1.7 Primary research and validation
- 1.7.1 Primary sources
- 1.8 Research trail & confidence scoring
- 1.8.1 Research trail components
- 1.8.2 Scoring components
- 1.9 Research transparency addendum
- 1.9.1 Source attribution framework
- 1.9.2 Quality assurance metrics
- 1.9.3 Our commitment to trust
Chapter 2 Executive Summary
- 2.1 Industry 360° synopsis
- 2.2 Key market trends
- 2.2.1 Country
- 2.2.2 Product type
- 2.2.3 Pollutant type
- 2.2.4 Operation type
- 2.2.5 End use industry
- 2.2.6 Distribution channel
Chapter 3 Industry Insights
- 3.1 Industry ecosystem analysis
- 3.1.1 Supplier landscape
- 3.1.2 Profit margin
- 3.1.3 Value addition at each stage
- 3.1.4 Factor affecting the value chain
- 3.2 Industry impact forces
- 3.2.1 Growth drivers
- 3.2.1.1 Stringent environmental and air emission regulations
- 3.2.1.2 Industrial modernization and capacity expansion
- 3.2.1.3 Growth in high-tech manufacturing
- 3.2.2 Industry pitfalls & challenges
- 3.2.2.1 High initial capital investment
- 3.2.2.2 High operating costs
- 3.2.3 Opportunities
- 3.2.3.1 Retrofit and upgrade projects
- 3.2.3.2 Semiconductor and electronics manufacturing
- 3.2.1 Growth drivers
- 3.3 Growth potential analysis
- 3.4 Regulatory framework
- 3.4.1 U.S. EPA clean air act - MACT & NESHAP standards
- 3.4.2 IMO MARPOL Annex VI (Marine Sulfur Cap - 0.5% global sulfur limit)
- 3.5 Pricing analysis (driven by primary research)
- 3.5.1 Historical price trend analysis (2022-2025)
- 3.5.2 Pricing strategy by player type (premium / value / cost-plus)
- 3.6 Trade data analysis (driven by paid database)
- 3.6.1 Import/export volume & value trends (HS Code 842139 industrial air scrubbers)
- 3.6.2 Key trade corridors & tariff impact
- 3.7 Impact of AI & generative AI on the market
- 3.7.1 AI-driven disruption of existing scrubber business models (monitoring-as-a-service, remote diagnostics)
- 3.7.2 GenAI use cases & adoption roadmap by segment
- 3.7.3 Risks, limitations & regulatory considerations for AI in pet care
- 3.8 Capacity & production landscape (driven by primary research)
- 3.8.1 Installed manufacturing capacity by region & key producer
- 3.8.2 Capacity utilization rates & expansion pipelines
Chapter 4 Competitive Landscape, 2025
- 4.1 Introduction
- 4.2 Company market share analysis
- 4.2.1 By country
- 4.2.1.1 U.S.
- 4.2.1.2 Canada
- 4.2.1 By country
- 4.3 Company matrix analysis
- 4.4 Competitive analysis of major market players
- 4.5 Competitive positioning matrix
- 4.6 Key developments
- 4.6.1 Mergers & acquisitions
- 4.6.2 Partnerships & collaborations
- 4.6.3 New product launches
- 4.6.4 Expansion plans
Chapter 5 Market Estimates and Forecast, By Product Type, 2022 – 2035 (USD Billion) (Units)
- 5.1 Key trends
- 5.2 Packed bed scrubbers
- 5.3 Venturi scrubbers
- 5.4 Spray tower scrubbers
- 5.5 Cyclonic scrubbers
- 5.6 Impingement plate scrubbers
- 5.7 Others (eductor scrubbers, biological/bio scrubbers, wet electrostatic precipitators)
Chapter 6 Market Estimates and Forecast, By Pollutant Type, 2022 – 2035 (USD Billion) (Units)
- 6.1 Key trends
- 6.2 Particulate matter (PM) control
- 6.3 Acid gas control
- 6.4 Volatile organic compounds (VOC) control
- 6.5 Odor control
- 6.6 Toxic fumes & heavy metals control
- 6.7 Others (multi-pollutant control systems, CO2 pre-treatment)
Chapter 7 Market Estimates and Forecast, By Operation Type, 2022 – 2035 (USD Billion) (Units)
- 7.1 Key trends
- 7.2 Open loop systems
- 7.3 Closed loop systems
- 7.4 Dry & wet hybrid systems
- 7.5 Others (semi-closed, hybrid-ready configurations)
Chapter 8 Market Estimates and Forecast, By End Use Industry, 2022 – 2035 (USD Billion) (Units)
- 8.1 Key trends
- 8.2 Chemical
- 8.3 Oil & gas
- 8.4 Refinery & petrochemicals
- 8.5 Mining & metallurgy
- 8.6 Pharmaceuticals
- 8.7 Others (marine, cement, power generation, Etc.)
Chapter 9 Market Estimates and Forecast, By Distribution Channel, 2022 – 2035 (USD Billion) (Units)
- 9.1 Key trends
- 9.2 Direct sales
- 9.3 Indirect sales
Chapter 10 Market Estimates and Forecast, By Country, 2022 – 2035 (USD Million) (Million Units)
- 10.1 Key trends
- 10.2 U.S.
- 10.3 Canada
Chapter 11 Company Profiles
- 11.1 Global players
- 11.1.1 Babcock & Wilcox (B&W)
- 11.1.2 CECO Environmental
- 11.1.3 Elessent Clean Technologies
- 11.1.4 ANDRITZ AG
- 11.1.5 GEA Group AG
- 11.1.6 Nederman MikroPul
- 11.1.7 Valmet Oyj
- 11.2 Regional players
- 11.2.1 Tri-Mer Corporation
- 11.2.2 Monroe Environmental
- 11.2.3 ECS Environmental Solutions
- 11.2.4 Ducon Technologies
- 11.2.5 Sly Inc.
- 11.2.6 PCC Group / AirPol
- 11.2.7 Epcon Industrial Systems
- 11.3 Emerging players
- 11.3.1 Bionomic Industries
- 11.3.2 Ship & Shore Environmental
- 11.3.3 Envitech Inc.
- 11.3.4 Pollution Systems Inc.
- 11.3.5 CR Clean Air Group
- 11.3.6 Viron International
- 11.3.7 Pollution Control Products Co. (PPC)

