
PUBLISHER: Global Market Insights Inc. | PRODUCT CODE: 1666580

PUBLISHER: Global Market Insights Inc. | PRODUCT CODE: 1666580
Heavy Duty Trucks Market Opportunity, Growth Drivers, Industry Trend Analysis, and Forecast 2025 - 2034
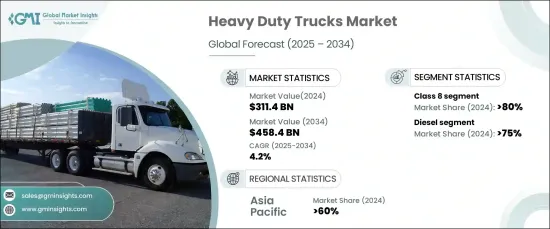
The Global Heavy Duty Trucks Market was valued at USD 311.4 billion in 2024 and is expected to grow at a CAGR of 4.2% from 2025 to 2034. This growth is largely attributed to the increasing global need for efficient goods transportation, driven by thriving commerce and expanding trade activities. Cross-border trade has gained momentum, necessitating advanced heavy-duty vehicles capable of handling substantial cargo volumes over long distances. Collaborative efforts among regions to streamline trade logistics and improve infrastructure are bolstering the adoption of heavy-duty trucks, particularly Class 8 vehicles.
Technological innovations are reshaping the market landscape, enhancing vehicle performance, safety, and operational efficiency. Advanced features like autonomous driving, telematics, and connectivity solutions are increasingly being integrated into heavy-duty trucks, making them more appealing to fleet operators. These technologies optimize fleet management, improve driver safety, and reduce operating costs, fostering demand for modernized truck models. With fleet operators prioritizing performance and cost efficiency, the adoption of technologically advanced heavy-duty trucks is on the rise globally.
| Market Scope | |
|---|---|
| Start Year | 2024 |
| Forecast Year | 2025-2034 |
| Start Value | $311.4 Billion |
| Forecast Value | $458.4 Billion |
| CAGR | 4.2% |
The market is segmented by vehicle class, with Class 8 trucks dominating the sector, accounting for over 80% of the market share in 2024. Known for their robust design and high gross vehicle weight rating (GVWR) exceeding 33,000 pounds, Class 8 trucks are indispensable for industries like logistics, construction, and agriculture. Their ability to transport heavy loads efficiently over long distances has solidified their position in global supply chains. Additionally, the incorporation of cutting-edge features such as fuel-efficient engines and smart systems makes them a preferred choice for fleet operators.
Fuel type segmentation reveals the dominance of diesel-powered trucks, which held over 75% of the market share in 2024. Diesel trucks are renowned for their unmatched power, reliability, and extensive range, making them essential for long-haul transportation and heavy-duty applications. Their continued prominence is supported by a well-established refueling infrastructure, ensuring seamless operations. Despite the gradual shift toward alternative fuels, diesel trucks remain a cornerstone of heavy-duty transportation due to their proven performance and versatility.
Asia Pacific leads the heavy-duty trucks market, contributing 60% of the revenue share in 2023. Rapid industrialization and urbanization across countries like China and India have heightened the demand for efficient transportation solutions. The booming e-commerce sector and expanding logistics networks further amplify the need for heavy-duty trucks. Additionally, government-led infrastructure initiatives and economic development strategies continue to propel market growth in the region. As Asia Pacific strengthens its position as a global economic hub, the heavy-duty trucks market is expected to maintain strong momentum.
Table of Contents
Chapter 1 Methodology & Scope
- 1.1 Research design
- 1.1.1 Research approach
- 1.1.2 Data collection methods
- 1.2 Base estimates & calculations
- 1.2.1 Base year calculation
- 1.2.2 Key trends for market estimation
- 1.3 Forecast model
- 1.4 Primary research and validation
- 1.4.1 Primary sources
- 1.4.2 Data mining sources
- 1.5 Market scope & definition
Chapter 2 Executive Summary
- 2.1 Industry 3600 synopsis, 2021 - 2034
Chapter 3 Industry Insights
- 3.1 Industry ecosystem analysis
- 3.2 Supplier landscape
- 3.2.1 Raw material suppliers
- 3.2.2 Component suppliers
- 3.2.3 Manufacturers
- 3.2.4 Technology providers
- 3.2.5 Distributors
- 3.2.6 End Use
- 3.3 Profit margin analysis
- 3.4 Technology & innovation landscape
- 3.5 Patent analysis
- 3.6 Regulatory landscape
- 3.7 Pricing analysis
- 3.8 Impact forces
- 3.8.1 Growth drivers
- 3.8.1.1 Escalating demand for autonomous driving technologies
- 3.8.1.2 Increasing long-haul freight activities bolstering heavy duty truck utilization
- 3.8.1.3 Introduction of advanced emission control systems due to strict regulations
- 3.8.1.4 Expansion of logistic networks and e-commerce globally
- 3.8.1.5 Technological advancements in trucking efficiency and safety features
- 3.8.2 Industry pitfalls & challenges
- 3.8.2.1 High cost of advanced technology integration
- 3.8.2.2 Economic slowdown affecting freight demand
- 3.8.1 Growth drivers
- 3.9 Growth potential analysis
- 3.10 Porter’s analysis
- 3.11 PESTEL analysis
Chapter 4 Competitive Landscape, 2024
- 4.1 Introduction
- 4.2 Company market share analysis
- 4.3 Competitive positioning matrix
- 4.4 Strategic outlook matrix
Chapter 5 Market Estimates & Forecast, By Class, 2021 - 2034 ($Bn, Unit)
- 5.1 Key trends
- 5.2 Class 7
- 5.2.1 Axle type
- 5.2.1.1 4X2
- 5.2.1.2 6X2
- 5.2.1.3 6X4
- 5.2.1 Axle type
- 5.3 Class 8
- 5.3.1 Axle type
- 5.3.1.1 4X2
- 5.3.1.2 6X2
- 5.3.1.3 6X4
- 5.3.2 Cab type
- 5.3.2.1 Day cab
- 5.3.2.2 Sleeper cab
- 5.3.1 Axle type
Chapter 6 Market Estimates & Forecast, By Fuel, 2021 - 2034 ($Bn, Unit)
- 6.1 Key trends
- 6.2 Diesel
- 6.3 Natural gas
- 6.4 Hybrid electric
- 6.5 Gasoline
Chapter 7 Market Estimates & Forecast, By Horsepower, 2021 - 2034 ($Bn, Unit)
- 7.1 Key trends
- 7.2 Below 300HP
- 7.3 300HP-400HP
- 7.4 400HP-500HP
- 7.5 Above 500HP
Chapter 8 Market Estimates & Forecast, By Application, 2021 - 2034 ($Bn, Unit)
- 8.1 Key trends
- 8.2 Freight delivery
- 8.3 Utility services
- 8.4 Construction & mining
- 8.5 Others
Chapter 9 Market Estimates & Forecast, By Ownership, 2021 - 2034 ($Bn, Unit)
- 9.1 Key trends
- 9.2 Fleet operator
- 9.3 Independent operator
Chapter 10 Market Estimates & Forecast, By Region, 2021 - 2034 ($Bn, Unit)
- 10.1 Key trends
- 10.2 North America
- 10.2.1 U.S.
- 10.2.2 Canada
- 10.3 Europe
- 10.3.1 UK
- 10.3.2 Germany
- 10.3.3 France
- 10.3.4 Italy
- 10.3.5 Russia
- 10.3.6 Belgium
- 10.3.7 Sweden
- 10.4 Asia Pacific
- 10.4.1 China
- 10.4.2 India
- 10.4.3 Japan
- 10.4.4 Australia
- 10.4.5 South Korea
- 10.4.6 Southeast Asia
- 10.5 Latin America
- 10.5.1 Brazil
- 10.5.2 Mexico
- 10.5.3 Argentina
- 10.6 MEA
- 10.6.1 UAE
- 10.6.2 South Africa
- 10.6.3 Saudi Arabia
Chapter 11 Company Profiles
- 11.1 BYD Auto
- 11.2 Daimler Trucks
- 11.3 Dongfeng
- 11.4 Freightliner
- 11.5 Hino Motors
- 11.6 Isuzu Motors
- 11.7 Kenworth
- 11.8 MAN
- 11.9 Navistar
- 11.10 PACCAR Inc
- 11.11 Peterbilt
- 11.12 SCANIA
- 11.13 SINOTRUK
- 11.14 TRATON GROUP
- 11.15 Volvo

