
PUBLISHER: 360iResearch | PRODUCT CODE: 1413654

PUBLISHER: 360iResearch | PRODUCT CODE: 1413654
Urea Market by Grade (Feed, Fertilizer, Technical), End-User Industry (Agriculture, Automotive, Chemical synthesis) - Global Forecast 2024-2030
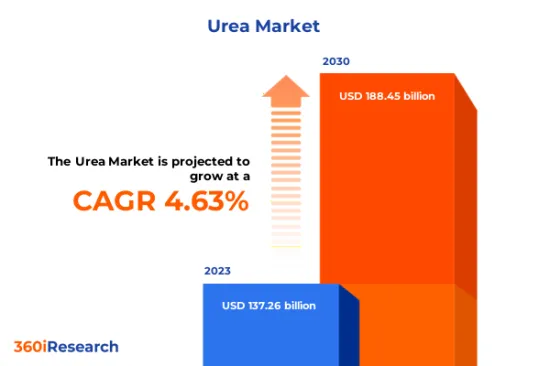
[191 Pages Report] The Urea Market size was estimated at USD 137.26 billion in 2023 and expected to reach USD 143.06 billion in 2024, at a CAGR 4.63% to reach USD 188.45 billion by 2030.
Global Urea Market
| KEY MARKET STATISTICS | |
|---|---|
| Base Year [2023] | USD 137.26 billion |
| Estimated Year [2024] | USD 143.06 billion |
| Forecast Year [2030] | USD 188.45 billion |
| CAGR (%) | 4.63% |
FPNV Positioning Matrix
The FPNV Positioning Matrix is pivotal in evaluating the Urea Market. It offers a comprehensive assessment of vendors, examining key metrics related to Business Strategy and Product Satisfaction. This in-depth analysis empowers users to make well-informed decisions aligned with their requirements. Based on the evaluation, the vendors are then categorized into four distinct quadrants representing varying levels of success: Forefront (F), Pathfinder (P), Niche (N), or Vital (V).
Market Share Analysis
The Market Share Analysis is a comprehensive tool that provides an insightful and in-depth examination of the current state of vendors in the Urea Market. By meticulously comparing and analyzing vendor contributions in terms of overall revenue, customer base, and other key metrics, we can offer companies a greater understanding of their performance and the challenges they face when competing for market share. Additionally, this analysis provides valuable insights into the competitive nature of the sector, including factors such as accumulation, fragmentation dominance, and amalgamation traits observed over the base year period studied. With this expanded level of detail, vendors can make more informed decisions and devise effective strategies to gain a competitive edge in the market.
Key Company Profiles
The report delves into recent significant developments in the Urea Market, highlighting leading vendors and their innovative profiles. These include Acron Group, BASF SE, CF Industries Holdings Inc., Chambal Fertilisers & Chemicals Ltd., China National Petroleum Corporation, Coromandel International Limited, EuroChem Group, IFFCO, Koch Fertilizer LLC, National Fertilizers Limited, Notore Chemical Industries PLC, Nutrien Ltd., OCI Global, Paradeep Phosphates Limited, Petrobras, PT Pupuk Kalimantan Timur (PKT), Quafco Qatar Fertilizer Company, SABIC, The Chemical Company, URALCHEM JSC, and Yara International ASA.
Market Segmentation & Coverage
This research report categorizes the Urea Market to forecast the revenues and analyze trends in each of the following sub-markets:
- Grade
- Feed
- Fertilizer
- Technical
- End-User Industry
- Agriculture
- Automotive
- Chemical synthesis
- Region
- Americas
- Argentina
- Brazil
- Canada
- Mexico
- United States
- California
- Florida
- Illinois
- New York
- Ohio
- Pennsylvania
- Texas
- Asia-Pacific
- Australia
- China
- India
- Indonesia
- Japan
- Malaysia
- Philippines
- Singapore
- South Korea
- Taiwan
- Thailand
- Vietnam
- Europe, Middle East & Africa
- Denmark
- Egypt
- Finland
- France
- Germany
- Israel
- Italy
- Netherlands
- Nigeria
- Norway
- Poland
- Qatar
- Russia
- Saudi Arabia
- South Africa
- Spain
- Sweden
- Switzerland
- Turkey
- United Arab Emirates
- United Kingdom
- Americas
The report offers valuable insights on the following aspects:
1. Market Penetration: It presents comprehensive information on the market provided by key players.
2. Market Development: It delves deep into lucrative emerging markets and analyzes the penetration across mature market segments.
3. Market Diversification: It provides detailed information on new product launches, untapped geographic regions, recent developments, and investments.
4. Competitive Assessment & Intelligence: It conducts an exhaustive assessment of market shares, strategies, products, certifications, regulatory approvals, patent landscape, and manufacturing capabilities of the leading players.
5. Product Development & Innovation: It offers intelligent insights on future technologies, R&D activities, and breakthrough product developments.
The report addresses key questions such as:
1. What is the market size and forecast of the Urea Market?
2. Which products, segments, applications, and areas should one consider investing in over the forecast period in the Urea Market?
3. What are the technology trends and regulatory frameworks in the Urea Market?
4. What is the market share of the leading vendors in the Urea Market?
5. Which modes and strategic moves are suitable for entering the Urea Market?
Table of Contents
1. Preface
- 1.1. Objectives of the Study
- 1.2. Market Segmentation & Coverage
- 1.3. Years Considered for the Study
- 1.4. Currency & Pricing
- 1.5. Language
- 1.6. Limitations
- 1.7. Assumptions
- 1.8. Stakeholders
2. Research Methodology
- 2.1. Define: Research Objective
- 2.2. Determine: Research Design
- 2.3. Prepare: Research Instrument
- 2.4. Collect: Data Source
- 2.5. Analyze: Data Interpretation
- 2.6. Formulate: Data Verification
- 2.7. Publish: Research Report
- 2.8. Repeat: Report Update
3. Executive Summary
4. Market Overview
- 4.1. Introduction
- 4.2. Urea Market, by Region
5. Market Insights
- 5.1. Market Dynamics
- 5.1.1. Drivers
- 5.1.1.1. Emphasis on agricultural productivity and need for high-quality fertilizers
- 5.1.1.2. Government support and subsidies for farmers to ensure consistent urea availability
- 5.1.1.3. Increasing use of urea in industrial production of plastics, resins, and adhesives
- 5.1.2. Restraints
- 5.1.2.1. Complexity associated with the manufacturing of urea
- 5.1.3. Opportunities
- 5.1.3.1. Technological advancements in urea production and processing
- 5.1.3.2. Ongoing research activities for the introduction of eco-friendly urea
- 5.1.4. Challenges
- 5.1.4.1. Health and environmental issues due to excessive use of urea
- 5.1.1. Drivers
- 5.2. Market Segmentation Analysis
- 5.3. Market Trend Analysis
- 5.4. Cumulative Impact of High Inflation
- 5.5. Porter's Five Forces Analysis
- 5.5.1. Threat of New Entrants
- 5.5.2. Threat of Substitutes
- 5.5.3. Bargaining Power of Customers
- 5.5.4. Bargaining Power of Suppliers
- 5.5.5. Industry Rivalry
- 5.6. Value Chain & Critical Path Analysis
- 5.7. Regulatory Framework
6. Urea Market, by Grade
- 6.1. Introduction
- 6.2. Feed
- 6.3. Fertilizer
- 6.4. Technical
7. Urea Market, by End-User Industry
- 7.1. Introduction
- 7.2. Agriculture
- 7.3. Automotive
- 7.4. Chemical synthesis
8. Americas Urea Market
- 8.1. Introduction
- 8.2. Argentina
- 8.3. Brazil
- 8.4. Canada
- 8.5. Mexico
- 8.6. United States
9. Asia-Pacific Urea Market
- 9.1. Introduction
- 9.2. Australia
- 9.3. China
- 9.4. India
- 9.5. Indonesia
- 9.6. Japan
- 9.7. Malaysia
- 9.8. Philippines
- 9.9. Singapore
- 9.10. South Korea
- 9.11. Taiwan
- 9.12. Thailand
- 9.13. Vietnam
10. Europe, Middle East & Africa Urea Market
- 10.1. Introduction
- 10.2. Denmark
- 10.3. Egypt
- 10.4. Finland
- 10.5. France
- 10.6. Germany
- 10.7. Israel
- 10.8. Italy
- 10.9. Netherlands
- 10.10. Nigeria
- 10.11. Norway
- 10.12. Poland
- 10.13. Qatar
- 10.14. Russia
- 10.15. Saudi Arabia
- 10.16. South Africa
- 10.17. Spain
- 10.18. Sweden
- 10.19. Switzerland
- 10.20. Turkey
- 10.21. United Arab Emirates
- 10.22. United Kingdom
11. Competitive Landscape
- 11.1. FPNV Positioning Matrix
- 11.2. Market Share Analysis, By Key Player
- 11.3. Competitive Scenario Analysis, By Key Player
12. Competitive Portfolio
- 12.1. Key Company Profiles
- 12.1.1. Acron Group
- 12.1.2. BASF SE
- 12.1.3. CF Industries Holdings Inc.
- 12.1.4. Chambal Fertilisers & Chemicals Ltd.
- 12.1.5. China National Petroleum Corporation
- 12.1.6. Coromandel International Limited
- 12.1.7. EuroChem Group
- 12.1.8. IFFCO
- 12.1.9. Koch Fertilizer LLC
- 12.1.10. National Fertilizers Limited
- 12.1.11. Notore Chemical Industries PLC
- 12.1.12. Nutrien Ltd.
- 12.1.13. OCI Global
- 12.1.14. Paradeep Phosphates Limited
- 12.1.15. Petrobras
- 12.1.16. PT Pupuk Kalimantan Timur (PKT)
- 12.1.17. Quafco Qatar Fertilizer Company
- 12.1.18. SABIC
- 12.1.19. The Chemical Company
- 12.1.20. URALCHEM JSC
- 12.1.21. Yara International ASA
- 12.2. Key Product Portfolio
13. Appendix
- 13.1. Discussion Guide
- 13.2. License & Pricing
LIST OF FIGURES
- FIGURE 1. UREA MARKET RESEARCH PROCESS
- FIGURE 2. UREA MARKET SIZE, 2023 VS 2030
- FIGURE 3. UREA MARKET SIZE, 2018-2030 (USD MILLION)
- FIGURE 4. UREA MARKET SIZE, BY REGION, 2023 VS 2030 (%)
- FIGURE 5. UREA MARKET SIZE, BY REGION, 2023 VS 2024 VS 2030 (USD MILLION)
- FIGURE 6. UREA MARKET DYNAMICS
- FIGURE 7. UREA MARKET SIZE, BY GRADE, 2023 VS 2030 (%)
- FIGURE 8. UREA MARKET SIZE, BY GRADE, 2023 VS 2024 VS 2030 (USD MILLION)
- FIGURE 9. UREA MARKET SIZE, BY END-USER INDUSTRY, 2023 VS 2030 (%)
- FIGURE 10. UREA MARKET SIZE, BY END-USER INDUSTRY, 2023 VS 2024 VS 2030 (USD MILLION)
- FIGURE 11. AMERICAS UREA MARKET SIZE, BY COUNTRY, 2023 VS 2030 (%)
- FIGURE 12. AMERICAS UREA MARKET SIZE, BY COUNTRY, 2023 VS 2024 VS 2030 (USD MILLION)
- FIGURE 13. UNITED STATES UREA MARKET SIZE, BY STATE, 2023 VS 2030 (%)
- FIGURE 14. UNITED STATES UREA MARKET SIZE, BY STATE, 2023 VS 2024 VS 2030 (USD MILLION)
- FIGURE 15. ASIA-PACIFIC UREA MARKET SIZE, BY COUNTRY, 2023 VS 2030 (%)
- FIGURE 16. ASIA-PACIFIC UREA MARKET SIZE, BY COUNTRY, 2023 VS 2024 VS 2030 (USD MILLION)
- FIGURE 17. EUROPE, MIDDLE EAST & AFRICA UREA MARKET SIZE, BY COUNTRY, 2023 VS 2030 (%)
- FIGURE 18. EUROPE, MIDDLE EAST & AFRICA UREA MARKET SIZE, BY COUNTRY, 2023 VS 2024 VS 2030 (USD MILLION)
- FIGURE 19. UREA MARKET, FPNV POSITIONING MATRIX, 2023
- FIGURE 20. UREA MARKET SHARE, BY KEY PLAYER, 2023
LIST OF TABLES
- TABLE 1. UREA MARKET SEGMENTATION & COVERAGE
- TABLE 2. UNITED STATES DOLLAR EXCHANGE RATE, 2018-2023
- TABLE 3. UREA MARKET SIZE, 2018-2030 (USD MILLION)
- TABLE 4. GLOBAL UREA MARKET SIZE, BY REGION, 2018-2030 (USD MILLION)
- TABLE 5. UREA MARKET SIZE, BY GRADE, 2018-2030 (USD MILLION)
- TABLE 6. UREA MARKET SIZE, BY FEED, BY REGION, 2018-2030 (USD MILLION)
- TABLE 7. UREA MARKET SIZE, BY FERTILIZER, BY REGION, 2018-2030 (USD MILLION)
- TABLE 8. UREA MARKET SIZE, BY TECHNICAL, BY REGION, 2018-2030 (USD MILLION)
- TABLE 9. UREA MARKET SIZE, BY END-USER INDUSTRY, 2018-2030 (USD MILLION)
- TABLE 10. UREA MARKET SIZE, BY AGRICULTURE, BY REGION, 2018-2030 (USD MILLION)
- TABLE 11. UREA MARKET SIZE, BY AUTOMOTIVE, BY REGION, 2018-2030 (USD MILLION)
- TABLE 12. UREA MARKET SIZE, BY CHEMICAL SYNTHESIS, BY REGION, 2018-2030 (USD MILLION)
- TABLE 13. AMERICAS UREA MARKET SIZE, BY GRADE, 2018-2030 (USD MILLION)
- TABLE 14. AMERICAS UREA MARKET SIZE, BY END-USER INDUSTRY, 2018-2030 (USD MILLION)
- TABLE 15. AMERICAS UREA MARKET SIZE, BY COUNTRY, 2018-2030 (USD MILLION)
- TABLE 16. ARGENTINA UREA MARKET SIZE, BY GRADE, 2018-2030 (USD MILLION)
- TABLE 17. ARGENTINA UREA MARKET SIZE, BY END-USER INDUSTRY, 2018-2030 (USD MILLION)
- TABLE 18. BRAZIL UREA MARKET SIZE, BY GRADE, 2018-2030 (USD MILLION)
- TABLE 19. BRAZIL UREA MARKET SIZE, BY END-USER INDUSTRY, 2018-2030 (USD MILLION)
- TABLE 20. CANADA UREA MARKET SIZE, BY GRADE, 2018-2030 (USD MILLION)
- TABLE 21. CANADA UREA MARKET SIZE, BY END-USER INDUSTRY, 2018-2030 (USD MILLION)
- TABLE 22. MEXICO UREA MARKET SIZE, BY GRADE, 2018-2030 (USD MILLION)
- TABLE 23. MEXICO UREA MARKET SIZE, BY END-USER INDUSTRY, 2018-2030 (USD MILLION)
- TABLE 24. UNITED STATES UREA MARKET SIZE, BY GRADE, 2018-2030 (USD MILLION)
- TABLE 25. UNITED STATES UREA MARKET SIZE, BY END-USER INDUSTRY, 2018-2030 (USD MILLION)
- TABLE 26. UNITED STATES UREA MARKET SIZE, BY STATE, 2018-2030 (USD MILLION)
- TABLE 27. ASIA-PACIFIC UREA MARKET SIZE, BY GRADE, 2018-2030 (USD MILLION)
- TABLE 28. ASIA-PACIFIC UREA MARKET SIZE, BY END-USER INDUSTRY, 2018-2030 (USD MILLION)
- TABLE 29. ASIA-PACIFIC UREA MARKET SIZE, BY COUNTRY, 2018-2030 (USD MILLION)
- TABLE 30. AUSTRALIA UREA MARKET SIZE, BY GRADE, 2018-2030 (USD MILLION)
- TABLE 31. AUSTRALIA UREA MARKET SIZE, BY END-USER INDUSTRY, 2018-2030 (USD MILLION)
- TABLE 32. CHINA UREA MARKET SIZE, BY GRADE, 2018-2030 (USD MILLION)
- TABLE 33. CHINA UREA MARKET SIZE, BY END-USER INDUSTRY, 2018-2030 (USD MILLION)
- TABLE 34. INDIA UREA MARKET SIZE, BY GRADE, 2018-2030 (USD MILLION)
- TABLE 35. INDIA UREA MARKET SIZE, BY END-USER INDUSTRY, 2018-2030 (USD MILLION)
- TABLE 36. INDONESIA UREA MARKET SIZE, BY GRADE, 2018-2030 (USD MILLION)
- TABLE 37. INDONESIA UREA MARKET SIZE, BY END-USER INDUSTRY, 2018-2030 (USD MILLION)
- TABLE 38. JAPAN UREA MARKET SIZE, BY GRADE, 2018-2030 (USD MILLION)
- TABLE 39. JAPAN UREA MARKET SIZE, BY END-USER INDUSTRY, 2018-2030 (USD MILLION)
- TABLE 40. MALAYSIA UREA MARKET SIZE, BY GRADE, 2018-2030 (USD MILLION)
- TABLE 41. MALAYSIA UREA MARKET SIZE, BY END-USER INDUSTRY, 2018-2030 (USD MILLION)
- TABLE 42. PHILIPPINES UREA MARKET SIZE, BY GRADE, 2018-2030 (USD MILLION)
- TABLE 43. PHILIPPINES UREA MARKET SIZE, BY END-USER INDUSTRY, 2018-2030 (USD MILLION)
- TABLE 44. SINGAPORE UREA MARKET SIZE, BY GRADE, 2018-2030 (USD MILLION)
- TABLE 45. SINGAPORE UREA MARKET SIZE, BY END-USER INDUSTRY, 2018-2030 (USD MILLION)
- TABLE 46. SOUTH KOREA UREA MARKET SIZE, BY GRADE, 2018-2030 (USD MILLION)
- TABLE 47. SOUTH KOREA UREA MARKET SIZE, BY END-USER INDUSTRY, 2018-2030 (USD MILLION)
- TABLE 48. TAIWAN UREA MARKET SIZE, BY GRADE, 2018-2030 (USD MILLION)
- TABLE 49. TAIWAN UREA MARKET SIZE, BY END-USER INDUSTRY, 2018-2030 (USD MILLION)
- TABLE 50. THAILAND UREA MARKET SIZE, BY GRADE, 2018-2030 (USD MILLION)
- TABLE 51. THAILAND UREA MARKET SIZE, BY END-USER INDUSTRY, 2018-2030 (USD MILLION)
- TABLE 52. VIETNAM UREA MARKET SIZE, BY GRADE, 2018-2030 (USD MILLION)
- TABLE 53. VIETNAM UREA MARKET SIZE, BY END-USER INDUSTRY, 2018-2030 (USD MILLION)
- TABLE 54. EUROPE, MIDDLE EAST & AFRICA UREA MARKET SIZE, BY GRADE, 2018-2030 (USD MILLION)
- TABLE 55. EUROPE, MIDDLE EAST & AFRICA UREA MARKET SIZE, BY END-USER INDUSTRY, 2018-2030 (USD MILLION)
- TABLE 56. EUROPE, MIDDLE EAST & AFRICA UREA MARKET SIZE, BY COUNTRY, 2018-2030 (USD MILLION)
- TABLE 57. DENMARK UREA MARKET SIZE, BY GRADE, 2018-2030 (USD MILLION)
- TABLE 58. DENMARK UREA MARKET SIZE, BY END-USER INDUSTRY, 2018-2030 (USD MILLION)
- TABLE 59. EGYPT UREA MARKET SIZE, BY GRADE, 2018-2030 (USD MILLION)
- TABLE 60. EGYPT UREA MARKET SIZE, BY END-USER INDUSTRY, 2018-2030 (USD MILLION)
- TABLE 61. FINLAND UREA MARKET SIZE, BY GRADE, 2018-2030 (USD MILLION)
- TABLE 62. FINLAND UREA MARKET SIZE, BY END-USER INDUSTRY, 2018-2030 (USD MILLION)
- TABLE 63. FRANCE UREA MARKET SIZE, BY GRADE, 2018-2030 (USD MILLION)
- TABLE 64. FRANCE UREA MARKET SIZE, BY END-USER INDUSTRY, 2018-2030 (USD MILLION)
- TABLE 65. GERMANY UREA MARKET SIZE, BY GRADE, 2018-2030 (USD MILLION)
- TABLE 66. GERMANY UREA MARKET SIZE, BY END-USER INDUSTRY, 2018-2030 (USD MILLION)
- TABLE 67. ISRAEL UREA MARKET SIZE, BY GRADE, 2018-2030 (USD MILLION)
- TABLE 68. ISRAEL UREA MARKET SIZE, BY END-USER INDUSTRY, 2018-2030 (USD MILLION)
- TABLE 69. ITALY UREA MARKET SIZE, BY GRADE, 2018-2030 (USD MILLION)
- TABLE 70. ITALY UREA MARKET SIZE, BY END-USER INDUSTRY, 2018-2030 (USD MILLION)
- TABLE 71. NETHERLANDS UREA MARKET SIZE, BY GRADE, 2018-2030 (USD MILLION)
- TABLE 72. NETHERLANDS UREA MARKET SIZE, BY END-USER INDUSTRY, 2018-2030 (USD MILLION)
- TABLE 73. NIGERIA UREA MARKET SIZE, BY GRADE, 2018-2030 (USD MILLION)
- TABLE 74. NIGERIA UREA MARKET SIZE, BY END-USER INDUSTRY, 2018-2030 (USD MILLION)
- TABLE 75. NORWAY UREA MARKET SIZE, BY GRADE, 2018-2030 (USD MILLION)
- TABLE 76. NORWAY UREA MARKET SIZE, BY END-USER INDUSTRY, 2018-2030 (USD MILLION)
- TABLE 77. POLAND UREA MARKET SIZE, BY GRADE, 2018-2030 (USD MILLION)
- TABLE 78. POLAND UREA MARKET SIZE, BY END-USER INDUSTRY, 2018-2030 (USD MILLION)
- TABLE 79. QATAR UREA MARKET SIZE, BY GRADE, 2018-2030 (USD MILLION)
- TABLE 80. QATAR UREA MARKET SIZE, BY END-USER INDUSTRY, 2018-2030 (USD MILLION)
- TABLE 81. RUSSIA UREA MARKET SIZE, BY GRADE, 2018-2030 (USD MILLION)
- TABLE 82. RUSSIA UREA MARKET SIZE, BY END-USER INDUSTRY, 2018-2030 (USD MILLION)
- TABLE 83. SAUDI ARABIA UREA MARKET SIZE, BY GRADE, 2018-2030 (USD MILLION)
- TABLE 84. SAUDI ARABIA UREA MARKET SIZE, BY END-USER INDUSTRY, 2018-2030 (USD MILLION)
- TABLE 85. SOUTH AFRICA UREA MARKET SIZE, BY GRADE, 2018-2030 (USD MILLION)
- TABLE 86. SOUTH AFRICA UREA MARKET SIZE, BY END-USER INDUSTRY, 2018-2030 (USD MILLION)
- TABLE 87. SPAIN UREA MARKET SIZE, BY GRADE, 2018-2030 (USD MILLION)
- TABLE 88. SPAIN UREA MARKET SIZE, BY END-USER INDUSTRY, 2018-2030 (USD MILLION)
- TABLE 89. SWEDEN UREA MARKET SIZE, BY GRADE, 2018-2030 (USD MILLION)
- TABLE 90. SWEDEN UREA MARKET SIZE, BY END-USER INDUSTRY, 2018-2030 (USD MILLION)
- TABLE 91. SWITZERLAND UREA MARKET SIZE, BY GRADE, 2018-2030 (USD MILLION)
- TABLE 92. SWITZERLAND UREA MARKET SIZE, BY END-USER INDUSTRY, 2018-2030 (USD MILLION)
- TABLE 93. TURKEY UREA MARKET SIZE, BY GRADE, 2018-2030 (USD MILLION)
- TABLE 94. TURKEY UREA MARKET SIZE, BY END-USER INDUSTRY, 2018-2030 (USD MILLION)
- TABLE 95. UNITED ARAB EMIRATES UREA MARKET SIZE, BY GRADE, 2018-2030 (USD MILLION)
- TABLE 96. UNITED ARAB EMIRATES UREA MARKET SIZE, BY END-USER INDUSTRY, 2018-2030 (USD MILLION)
- TABLE 97. UNITED KINGDOM UREA MARKET SIZE, BY GRADE, 2018-2030 (USD MILLION)
- TABLE 98. UNITED KINGDOM UREA MARKET SIZE, BY END-USER INDUSTRY, 2018-2030 (USD MILLION)
- TABLE 99. UREA MARKET, FPNV POSITIONING MATRIX, 2023
- TABLE 100. UREA MARKET SHARE, BY KEY PLAYER, 2023
- TABLE 101. UREA MARKET LICENSE & PRICING

