
PUBLISHER: MarketsandMarkets | PRODUCT CODE: 1797408

PUBLISHER: MarketsandMarkets | PRODUCT CODE: 1797408
Power Transformer Market by Power Rating (Small, Medium, Large), Cooling Type (Oil-cooled, Air-cooled), Phase (Single Phase, Three Phase), End Use (Utilities, Residential & Commercial, Industrial), and Region - Global Forecast to 2030
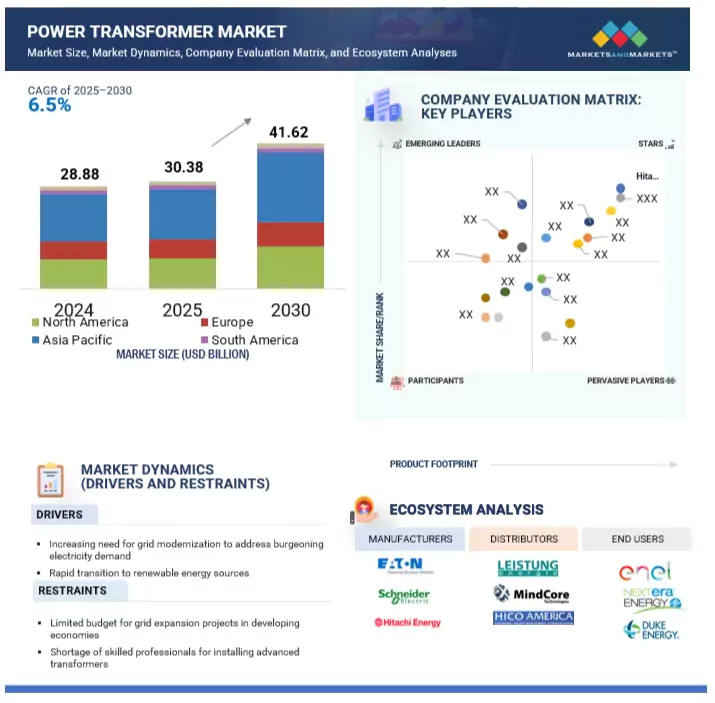
The global power transformer market is projected to grow from USD 30.38 billion in 2025 to USD 41.62 billion by 2030, at a CAGR of 6.5% during the forecast period. This upward trajectory is primarily driven by the rising global demand for electricity, fueled by rapid industrialization, expanding manufacturing activities, and ongoing infrastructure development across developed and emerging economies.
| Scope of the Report | |
|---|---|
| Years Considered for the Study | 2020-2030 |
| Base Year | 2024 |
| Forecast Period | 2025-2030 |
| Units Considered | Value (USD Million) and Volume (Units) |
| Segments | By Power Rating, By Phase, By Cooling Type, and By End Use |
| Regions covered | Asia Pacific, North America, Europe, the Middle East and Africa, and South America |
The industrial sector, in particular, is a major contributor to this demand, as modern facilities require robust and efficient power distribution systems, where power transformers are crucial. In addition to industrial applications, the market is experiencing growing demand from the commercial, service, and residential sectors. Commercial operations increasingly rely on uninterrupted power to maintain productivity, while the service sectors, including healthcare, education, and hospitality, are seeing a surge in electricity consumption to support digital infrastructure and service delivery. Meanwhile, population growth and urbanization drive the need for a reliable and consistent power supply in residential areas. Together, these trends underscore the critical role of power transformers in ensuring stable energy distribution across diverse end-use sectors.
"By power rating, large (above 600 MVA) is anticipated to be the fastest-growing segment from 2025 to 2030"
The large (above 600 MVA) segment is expected to exhibit the highest CAGR from 2025 to 2030. The global shift toward renewable energy and the deployment of utility-scale wind and solar projects result in the rising demand for high-capacity transmission systems capable of efficiently handling high voltages over long distances, making large transformers essential. In rapidly industrializing and urbanizing regions, expanding and modernizing power grids to support rising energy consumption further accelerates the need for these high-capacity units. Additionally, the increasing trend of cross-border grid interconnections aimed at improving power supply reliability and stability boosts the demand for large power transformers. In developed economies, efforts to replace aging infrastructure with advanced, energy-efficient systems also contribute to this growth. These developments position large power transformers as critical enablers of resilient, future-ready energy networks, supporting traditional and renewable power systems.
"Based on phase type, the three-phase transformers segment is projected to hold the largest market share in 2030"
The three-phase transformer segment is expected to hold the largest market share in 2030. It is driven by its widespread use across commercial, industrial, and utility sectors that require high-capacity solutions for efficient power transmission and distribution. These transformers are well-suited for high-load applications, offering superior efficiency, stable power flow, and reduced energy losses. These factors make transformers essential in settings with substantial and continuous power demands. As global energy consumption rises alongside expanding industrial operations and infrastructure development, the demand for reliable and high-performance transformers continues to grow. Moreover, three-phase transformers are critical in integrating renewable energy sources into the grid, supporting the global shift toward cleaner and more sustainable energy systems. Their ability to manage larger electrical loads efficiently and their versatility across various high-demand sectors solidify their position as the leading segment in the power transformer market over the forecast period.
"North America is expected to be the second fastest-growing region in the power transformer market during the forecast period"
North America is projected to be the second fastest-growing region in the power transformer market during the forecast period due to a strong focus on upgrading aging grid infrastructure, integrating renewable energy sources, and meeting increasing electricity demand driven by data centers, electric vehicles, and industrial automation. The proactive approach to modernizing transmission and distribution networks and government initiatives supporting clean energy transitions significantly boosts the demand for high-efficiency power transformers. In addition, the presence of major industry players, technological advancements, and regulatory policies emphasizing energy reliability and grid resilience further contribute to the robust growth in the power transformer market during the forecast period.
Breakdown of Primaries:
Through in-depth interviews with subject-matter experts, C-level executives of leading market players, industry consultants, and other specialists, significant qualitative and quantitative data were obtained and confirmed, along with future market prospects. The primary interviews were distributed as follows:
By Company Type: Tier 1 - 45%, Tier 2 - 40%, and Tier 3 - 15%
By Designation: C-Level Executives - 35%, Directors- 25%, and Others - 40%
By Region: North America - 18%, Europe - 15%, Asia Pacific - 50%, Middle East & Africa - 10%, and South America - 7%
Note: "Others" include sales managers, engineers, and regional managers
The tiers of the companies are defined based on their total revenue as of 2022: Tier 1: >USD 1 billion, Tier 2: USD 500 million-1 billion, and Tier 3: <USD 500 million.
International giants primarily dominate the power transformer market. Some leading companies operating in the power transformer market include Hitachi Energy (Japan), General Electric (US), Siemens (Germany), Mitsubishi Electric (Japan), Eaton Corporation (Ireland), Hyundai Electric (South Korea), Schneider Electric (France), Fuji Electric (Japan), Toshiba Energy System & Solution Corporation (Japan), and CG Power and Industrial Solutions (India).
Research Coverage:
This report presents a comprehensive analysis of the power transformer market, offering detailed definitions, descriptions, and forward-looking projections across key parameters. The study is segmented by phase (single-phase and three-phase), power rating [small (up to 60 MVA), medium (61-600 MVA), and large (above 600 MVA)], cooling type (oil-cooled and air-cooled), and end use (industrial, residential & commercial, and utilities). It also provides a regional breakdown covering Asia Pacific, North America, Europe, the Middle East & Africa, and South America. The report delivers qualitative and quantitative insights, highlighting key market drivers, restraints, opportunities, and challenges shaping the industry. In addition, it includes an in-depth assessment of market dynamics, value-based forecasts, competitive landscape analysis, and emerging trends, offering a holistic view of the current state and future outlook of the global power transformer market.
Key Benefits of Buying the Report
The report is thoughtfully designed to meet the needs of seasoned industry leaders and new entrants in the power transformer market. It provides dependable revenue projections for the overall market and its various sub-segments, making it a crucial tool for stakeholders looking to understand the competitive environment deeply. This information helps stakeholders develop effective market strategies for their businesses. Furthermore, the report serves as a key resource for stakeholders to grasp the current market scenario, offering vital insights into the drivers, constraints, challenges, and opportunities for growth. With these insights, stakeholders can make well-informed decisions and keep up with the rapidly changing dynamics of the Power Transformers industry.
- Analysis of key drivers (Growing electricity demand, Rising integration of renewable energy sources), restraints (Cost pressures and lead times, Limited market penetration in developing economies), opportunities (Rise of decentralized generation, Smart grid development and rise of advanced transformers), and challenges (Aging infrastructure and shortage of skilled workforce, Cybersecurity threats amid power grid digitalization) influencing the growth of the power transformer market.
- Product Development/ Innovation: Product development and innovation are pivotal in advancing the power transformer market. With continuous technological progress, manufacturers increasingly focus on creating high-performance, energy-efficient, safe transformer solutions. These innovations often incorporate smart features, advanced materials, and eco-friendly insulation technologies to meet the evolving demands of modern power distribution systems. Research and development efforts also aim to produce transformers that align with global sustainability goals and environmental standards. In the power transformer segment, companies leverage cutting-edge design techniques and technologies to meet but exceed industry requirements, delivering solutions that enhance the efficiency, reliability, and longevity of power networks. This ongoing emphasis on innovation underscores the industry's commitment to addressing emerging challenges and improving the overall functionality and adaptability of power transformers in a rapidly changing energy landscape.
- Market Development: Market development in the power transformer market is a continuous and strategic process, driven by the pursuit of new geographic opportunities and diversified application areas. Companies in this sector are actively expanding their footprint by entering untapped regions and adapting their products to cater to evolving customer needs across various industries. This includes aligning offerings with emerging trends, such as integrating renewable energy sources and modernizing aging grid infrastructure. Through these efforts, businesses broaden their customer base and refine their solutions to address the specific requirements of different end-use segments. Market development strategies often involve partnerships, joint ventures, and alliances to strengthen market positioning and enhance global reach. By staying responsive to shifting energy demands and technological advancements, companies ensure sustained growth, improved competitiveness, and long-term relevance in the dynamic and essential power transformer market.
- Market Diversification: Market diversification in the power transformer market is a strategic approach aimed at reducing dependency on specific products or markets while unlocking new growth opportunities and enhancing overall business resilience. Companies achieve this by expanding their product portfolios-offering a range of transformer types, voltage capacities, and application-specific solutions-to meet the varying needs of diverse customer segments. This can involve targeting niche markets, developing customized solutions for specialized industries, or adapting products to suit emerging technologies, such as renewable energy integration and smart grid infrastructure. Geographic diversification is another key element, allowing companies to enter new regions or countries with distinct energy demands and regulatory landscapes. Successful diversification relies on a deep understanding of industry trends, customer requirements, and technological innovations, enabling businesses to remain agile in a rapidly evolving market. By embracing a well-rounded diversification strategy, companies can better manage economic uncertainties, capture emerging opportunities, and sustain a competitive edge in the dynamic power transformer landscape.
- Competitive Assessment: An extensive analysis of the market presence, growth plans, and service offerings of major competitors in the power transformer market has been conducted. This research has been applied to notable firms including Hitachi Energy (Japan), Siemens Energy (Germany), Toshiba Energy System & Solution Corporation (Japan), General Electric (US), Hyundai Electric (South Korea), Fuji Electric (Japan), MGM Transformer Company (California), and CG Power and Industrial Solutions (India). The assessment provides an in-depth understanding of these big players' competitive positions, illuminating their growth-oriented strategies and range of offerings in the power transformer market.
TABLE OF CONTENTS
1 INTRODUCTION
- 1.1 STUDY OBJECTIVES
- 1.2 MARKET DEFINITION
- 1.3 STUDY SCOPE
- 1.3.1 MARKETS COVERED
- 1.3.2 INCLUSIONS AND EXCLUSIONS
- 1.3.3 YEARS CONSIDERED
- 1.4 CURRENCY CONSIDERED
- 1.5 UNITS CONSIDERED
- 1.6 LIMITATIONS
- 1.7 STAKEHOLDERS
- 1.8 SUMMARY OF CHANGES
2 RESEARCH METHODOLOGY
- 2.1 RESEARCH DATA
- 2.1.1 SECONDARY DATA
- 2.1.1.1 List of key secondary sources
- 2.1.1.2 Key data from secondary sources
- 2.1.2 PRIMARY DATA
- 2.1.2.1 List of primary interview participants
- 2.1.2.2 Key industry insights
- 2.1.2.3 Key data from primary sources
- 2.1.2.4 Breakdown of primaries
- 2.1.1 SECONDARY DATA
- 2.2 MARKET SIZE ESTIMATION METHODOLOGY
- 2.2.1 BOTTOM-UP APPROACH
- 2.2.1.1 Approach to arrive at market size using bottom-up analysis (demand side)
- 2.2.1.2 Regional analysis
- 2.2.1.3 Country-level analysis
- 2.2.1.4 Demand-side assumptions
- 2.2.1.5 Demand-side calculations
- 2.2.2 TOP-DOWN APPROACH
- 2.2.2.1 Approach to arrive at market size using top-down analysis (supply side)
- 2.2.2.2 Supply-side assumptions
- 2.2.2.3 Supply-side calculations
- 2.2.1 BOTTOM-UP APPROACH
- 2.3 MARKET GROWTH FORECAST
- 2.4 MARKET BREAKDOWN AND DATA TRIANGULATION
- 2.5 RESEARCH ASSUMPTIONS
- 2.6 RISK ASSESSMENT
- 2.7 RESEARCH LIMITATIONS
3 EXECUTIVE SUMMARY
4 PREMIUM INSIGHTS
- 4.1 ATTRACTIVE OPPORTUNITIES FOR PLAYERS IN POWER TRANSFORMER MARKET
- 4.2 POWER TRANSFORMER MARKET, BY REGION
- 4.3 POWER TRANSFORMER MARKET IN ASIA PACIFIC, BY PHASE AND COUNTRY
- 4.4 POWER TRANSFORMER MARKET, BY POWER RATING
- 4.5 POWER TRANSFORMER MARKET, BY PHASE
- 4.6 POWER TRANSFORMER MARKET, BY COOLING TYPE
- 4.7 POWER TRANSFORMER MARKET, BY END USER
5 MARKET OVERVIEW
- 5.1 INTRODUCTION
- 5.2 MARKET DYNAMICS
- 5.2.1 DRIVERS
- 5.2.1.1 Rising focus on grid modernization to meet peak power demand
- 5.2.1.2 Increasing emphasis on renewable energy capacity expansion
- 5.2.2 RESTRAINTS
- 5.2.2.1 Limited budget for grid expansion projects in developing economies
- 5.2.2.2 Shortage of skilled professionals for installing advanced transformers
- 5.2.3 OPPORTUNITIES
- 5.2.3.1 Rise of decentralized power generation
- 5.2.3.2 Shift from traditional to smart grid infrastructure
- 5.2.4 CHALLENGES
- 5.2.4.1 Cybersecurity threats posed by grid digitalization
- 5.2.1 DRIVERS
- 5.3 PORTER'S FIVE FORCES ANALYSIS
- 5.3.1 THREAT OF SUBSTITUTES
- 5.3.2 BARGAINING POWER OF SUPPLIERS
- 5.3.3 BARGAINING POWER OF BUYERS
- 5.3.4 THREAT OF NEW ENTRANTS
- 5.3.5 INTENSITY OF COMPETITIVE RIVALRY
- 5.4 SUPPLY CHAIN ANALYSIS
- 5.5 TECHNOLOGY ANALYSIS
- 5.5.1 KEY TECHNOLOGIES
- 5.5.1.1 High-temperature superconducting (HTS) transformers
- 5.5.2 COMPLEMENTARY TECHNOLOGIES
- 5.5.2.1 Artificial intelligence-based digital fault protection relays
- 5.5.3 ADJACENT TECHNOLOGIES
- 5.5.3.1 Digital twin technology
- 5.5.1 KEY TECHNOLOGIES
- 5.6 KEY CONFERENCES AND EVENTS, 2024
- 5.7 ECOSYSTEM ANALYSIS
- 5.8 PATENT ANALYSIS
- 5.9 CASE STUDY ANALYSIS
- 5.9.1 ABB IMPLEMENTS ONLINE OIL RECLAMATION SERVICE TO ADDRESS DETERIORATING OIL CONDITION OF TRANSFORMERS AT DEESIDE POWER STATION
- 5.9.2 SPECIALIZED EQUIPMENT AND ECO-FRIENDLY TECHNIQUES ADDRESS OIL LEAKS AND ENHANCE TRANSFORMER SAFETY AT CENTRAL CITY SUBSTATION
- 5.9.3 COMPREHENSIVE TESTING AND MAINTENANCE PROGRAMS HELP ADDRESS MINOR LEAKS AND OPERATIONAL HAZARDS OF AGING TRANSFORMERS AT BIG RIVER SUBSTATION
- 5.10 TRADE ANALYSIS
- 5.10.1 IMPORT SCENARIO (HS CODE 850423 AND HS CODE 850434)
- 5.10.2 EXPORT SCENARIO (HS CODE 850423 AND HS CODE 850434)
- 5.11 PRICING ANALYSIS
- 5.11.1 INDICATIVE PRICING ANALYSIS, BY POWER RATING
- 5.11.2 AVERAGE SELLING PRICE TREND, BY REGION
- 5.12 INVESTMENT AND FUNDING SCENARIO
- 5.13 TARIFF AND REGULATORY LANDSCAPE
- 5.13.1 TARIFF ANALYSIS
- 5.13.2 REGULATORY BODIES, GOVERNMENT AGENCIES, AND OTHER ORGANIZATIONS
- 5.13.3 CODES AND REGULATIONS
- 5.14 TRENDS/DISRUPTIONS IMPACTING CUSTOMER BUSINESS
- 5.15 KEY STAKEHOLDERS AND BUYING CRITERIA
- 5.15.1 KEY STAKEHOLDERS IN BUYING PROCESS
- 5.15.2 BUYING CRITERIA
- 5.16 IMPACT OF GEN AI/AI IN POWER TRANSFORMER MARKET
- 5.16.1 ADOPTION OF GEN AI/AI IN POWER TRANSFORMER MARKET
- 5.16.2 IMPACT OF GEN AI/AI ON POWER TRANSFORMER MARKET, BY REGION
- 5.17 IMPACT OF 2025 US TARIFF ON POWER TRANSFORMER MARKET
- 5.17.1 INTRODUCTION
- 5.17.2 KEY TARIFF RATES
- 5.17.3 PRICE IMPACT ANALYSIS
- 5.17.4 IMPACT ON COUNTRIES/REGIONS
- 5.17.4.1 US
- 5.17.4.2 Europe
- 5.17.4.3 Asia Pacific
- 5.17.5 IMPACT ON END USERS
6 POWER TRANSFORMER MARKET, BY POWER RATING
- 6.1 INTRODUCTION
- 6.2 UP TO 60 MVA
- 6.2.1 UTILITY SUBSTATION EXPANSION AND RURAL ELECTRIFICATION TO FUEL DEMAND
- 6.3 61-600 MVA
- 6.3.1 RAPID INDUSTRIALIZATION AND GRID INTERCONNECTION PROJECTS TO ACCELERATE SEGMENTAL GROWTH
- 6.4 ABOVE 600 MVA
- 6.4.1 BULK POWER TRANSMISSION AND CROSS-BORDER INTERCONNECTORS TO DRIVE DEMAND
7 POWER TRANSFORMERS MARKET, BY COOLING TYPE
- 7.1 INTRODUCTION
- 7.2 OIL-COOLED
- 7.2.1 EXCELLENT THERMAL PROPERTIES AND RELIABILITY TO FOSTER SEGMENTAL GROWTH
- 7.3 AIR-COOLED
- 7.3.1 SIMPLICITY AND LOW-MAINTENANCE REQUIREMENTS TO SUPPORT MARKET GROWTH
8 POWER TRANSFORMER MARKET, BY PHASE
- 8.1 INTRODUCTION
- 8.2 SINGLE-PHASE
- 8.2.1 LOW MANUFACTURING COSTS AND EASY INSTALLATION TO CONTRIBUTE TO SEGMENTAL GROWTH
- 8.3 THREE-PHASE
- 8.3.1 BALANCED POWER DISTRIBUTION AND HIGH EFFICIENCY TO DRIVE MARKET
9 POWER TRANSFORMER MARKET, BY END USER
- 9.1 INTRODUCTION
- 9.2 UTILITIES
- 9.2.1 INCREASING GOVERNMENT INVESTMENT IN SMART GRID TECHNOLOGIES TO DRIVE MARKET
- 9.3 RESIDENTIAL & COMMERCIAL
- 9.3.1 GROWING DEMAND FOR DISTRIBUTION TRANSFORMERS TO ENSURE UNINTERRUPTED POWER SUPPLY TO FOSTER SEGMENTAL GROWTH
- 9.4 INDUSTRIAL
- 9.4.1 OIL & GAS
- 9.4.1.1 Increasing need for high-efficiency transformers to facilitate pipeline operations to drive market
- 9.4.2 METALS & MINING
- 9.4.2.1 Growing demand for amorphous core transformers for mineral extraction, refining, and processing to foster segmental growth
- 9.4.3 AUTOMOTIVE
- 9.4.3.1 Expansion of electric vehicle charging infrastructure to boost segmental growth
- 9.4.4 FOOD & BEVERAGES
- 9.4.4.1 Increasing reliance on food refrigeration and freezing units to contribute to market growth
- 9.4.5 POWER GENERATION
- 9.4.5.1 Rising emphasis on grid modernization and sustainability to fuel demand
- 9.4.6 DATA CENTERS
- 9.4.6.1 Growing demand for UPS transformers to ensure uninterrupted operation to fuel segmental growth
- 9.4.7 OTHER INDUSTRIES
- 9.4.1 OIL & GAS
10 POWER TRANSFORMER MARKET, BY REGION
- 10.1 INTRODUCTION
- 10.2 NORTH AMERICA
- 10.2.1 US
- 10.2.1.1 Rising preference for renewable energy sources to contribute to market growth
- 10.2.2 CANADA
- 10.2.2.1 Increasing government initiatives to support grid modernization and increase energy efficiency to drive market
- 10.2.3 MEXICO
- 10.2.3.1 Growing population and industrialization to contribute to market growth
- 10.2.1 US
- 10.3 EUROPE
- 10.3.1 GERMANY
- 10.3.1.1 Rising emphasis on transitioning to sustainable energy sources to maintain grid resilience to propel market
- 10.3.2 UK
- 10.3.2.1 Increasing focus on achieving net-zero carbon footprint and modernizing grid to fuel market growth
- 10.3.3 ITALY
- 10.3.3.1 Mounting government investment in power transmission and distribution networks to drive market
- 10.3.4 FRANCE
- 10.3.4.1 Rising concerns about aging infrastructure to contribute to market growth
- 10.3.5 SPAIN
- 10.3.5.1 Escalating private investment in smart grid infrastructure to foster market growth
- 10.3.6 REST OF EUROPE
- 10.3.1 GERMANY
- 10.4 ASIA PACIFIC
- 10.4.1 CHINA
- 10.4.1.1 Rapid industrialization and infrastructural development to accelerate market growth
- 10.4.2 INDIA
- 10.4.2.1 Growth of electric vehicle charging infrastructure to drive market
- 10.4.3 JAPAN
- 10.4.3.1 Heightened emphasis on integrating smart grids and renewable energy to fuel market growth
- 10.4.4 SOUTH KOREA
- 10.4.4.1 Robust energy infrastructure and grid modernization efforts to drive demand
- 10.4.5 AUSTRALIA
- 10.4.5.1 Shift to renewable energy sources to contribute to market growth
- 10.4.6 REST OF ASIA PACIFIC
- 10.4.1 CHINA
- 10.5 MIDDLE EAST & AFRICA
- 10.5.1 GCC COUNTRIES
- 10.5.1.1 Saudi Arabia
- 10.5.1.1.1 Transition from petroleum to balanced mix of natural gas and renewable energy for power generation to drive market
- 10.5.1.2 UAE
- 10.5.1.2.1 Implementation of initiatives to increase access to reliable and sustainable electricity to augment market growth
- 10.5.1.3 Rest of GCC countries
- 10.5.1.1 Saudi Arabia
- 10.5.2 SOUTH AFRICA
- 10.5.2.1 Increasing investment in power infrastructure due to industrialization to fuel market growth
- 10.5.3 REST OF MIDDLE EAST & AFRICA
- 10.5.1 GCC COUNTRIES
- 10.6 SOUTH AMERICA
- 10.6.1 BRAZIL
- 10.6.1.1 Increasing electricity consumption due to economic development and urbanization to accelerate market growth
- 10.6.2 ARGENTINA
- 10.6.2.1 Rising power generation from renewable sources to fuel market growth
- 10.6.3 REST OF SOUTH AMERICA
- 10.6.1 BRAZIL
11 COMPETITIVE LANDSCAPE
- 11.1 INTRODUCTION
- 11.2 KEY PLAYER STRATEGIES/RIGHT TO WIN, 2022-2025
- 11.3 MARKET SHARE ANALYSIS, 2024
- 11.4 REVENUE ANALYSIS, 2020-2024
- 11.5 COMPANY VALUATION AND FINANCIAL METRICS
- 11.6 BRAND/PRODUCT COMPARISON
- 11.7 COMPANY EVALUATION MATRIX: KEY PLAYERS, 2024
- 11.7.1 STARS
- 11.7.2 EMERGING LEADERS
- 11.7.3 PERVASIVE PLAYERS
- 11.7.4 PARTICIPANTS
- 11.7.5 COMPANY FOOTPRINT: KEY PLAYERS, 2024
- 11.7.5.1 Company footprint
- 11.7.5.2 Region footprint
- 11.7.5.3 Phase footprint
- 11.7.5.4 Power rating footprint
- 11.7.5.5 Cooling type footprint
- 11.7.5.6 End user footprint
- 11.8 COMPANY EVALUATION MATRIX: STARTUPS/SMES, 2024
- 11.8.1 PROGRESSIVE COMPANIES
- 11.8.2 RESPONSIVE COMPANIES
- 11.8.3 DYNAMIC COMPANIES
- 11.8.4 STARTING BLOCKS
- 11.8.5 COMPETITIVE BENCHMARKING: STARTUPS/SMES, 2024
- 11.8.5.1 Detailed list of key startups/SMEs
- 11.8.5.2 Competitive benchmarking of key startups/SMEs
- 11.9 COMPETITIVE SCENARIO
- 11.9.1 PRODUCT LAUNCHES
- 11.9.2 DEALS
- 11.9.3 EXPANSIONS
- 11.9.4 OTHER DEVELOPMENTS
12 COMPANY PROFILES
- 12.1 KEY PLAYERS
- 12.1.1 SIEMENS ENERGY
- 12.1.1.1 Business overview
- 12.1.1.2 Products/Services/Solutions offered
- 12.1.1.3 Recent developments
- 12.1.1.3.1 Product launches
- 12.1.1.3.2 Deals
- 12.1.1.3.3 Expansions
- 12.1.1.3.4 Other developments
- 12.1.1.4 MnM view
- 12.1.1.4.1 Key strengths
- 12.1.1.4.2 Strategic choices
- 12.1.1.4.3 Weaknesses and competitive threats
- 12.1.2 HITACHI ENERGY LTD.
- 12.1.2.1 Business overview
- 12.1.2.2 Products/Services/Solutions offered
- 12.1.2.3 Recent developments
- 12.1.2.3.1 Product launches
- 12.1.2.3.2 Deals
- 12.1.2.3.3 Expansions
- 12.1.2.3.4 Other developments
- 12.1.2.4 MnM view
- 12.1.2.4.1 Key strengths
- 12.1.2.4.2 Strategic choices
- 12.1.2.4.3 Weaknesses and competitive threats
- 12.1.3 TOSHIBA ENERGY SYSTEMS & SOLUTIONS CORPORATION
- 12.1.3.1 Business overview
- 12.1.3.2 Products/Services/Solutions offered
- 12.1.3.3 Recent developments
- 12.1.3.3.1 Other developments
- 12.1.3.4 MnM view
- 12.1.3.4.1 Key strengths
- 12.1.3.4.2 Strategic choices
- 12.1.3.4.3 Weaknesses and competitive threats
- 12.1.4 HD HYUNDAI ELECTRIC CO., LTD.
- 12.1.4.1 Business overview
- 12.1.4.2 Products/Services/Solutions offered
- 12.1.4.3 Recent developments
- 12.1.4.3.1 Other developments
- 12.1.4.4 MnM view
- 12.1.4.4.1 Key strengths
- 12.1.4.4.2 Strategic choices
- 12.1.4.4.3 Weaknesses and competitive threats
- 12.1.5 GE VERNOVA
- 12.1.5.1 Business overview
- 12.1.5.2 Products/Services/Solutions offered
- 12.1.5.3 Recent developments
- 12.1.5.3.1 Product launches
- 12.1.5.3.2 Deals
- 12.1.5.3.3 Expansions
- 12.1.5.3.4 Other developments
- 12.1.5.4 MnM view
- 12.1.5.4.1 Key strengths
- 12.1.5.4.2 Strategic choices
- 12.1.5.4.3 Weaknesses and competitive threats
- 12.1.6 SCHNEIDER ELECTRIC
- 12.1.6.1 Business overview
- 12.1.6.2 Products/Services/Solutions offered
- 12.1.6.3 Recent developments
- 12.1.6.3.1 Product launches
- 12.1.6.3.2 Deals
- 12.1.6.3.3 Expansions
- 12.1.6.3.4 Other developments
- 12.1.7 CG POWER AND INDUSTRIAL SOLUTIONS LTD.
- 12.1.7.1 Business Overview
- 12.1.7.2 Products/Services/Solutions offered
- 12.1.7.3 Recent developments
- 12.1.7.3.1 Deals
- 12.1.7.3.2 Expansions
- 12.1.7.3.3 Other developments
- 12.1.8 MITSUBISHI ELECTRIC CORPORATION
- 12.1.8.1 Business overview
- 12.1.8.2 Products/Services/Solutions offered
- 12.1.8.3 Recent developments
- 12.1.8.3.1 Deals
- 12.1.8.3.2 Other developments
- 12.1.9 HYOSUNG HEAVY INDUSTRIES
- 12.1.9.1 Business overview
- 12.1.9.2 Products/Services/Solutions offered
- 12.1.9.3 Recent developments
- 12.1.9.3.1 Expansions
- 12.1.9.3.2 Other developments
- 12.1.10 BHARAT HEAVY ELECTRICALS LIMITED
- 12.1.10.1 Business overview
- 12.1.10.2 Products/Services/Solutions offered
- 12.1.10.3 Recent developments
- 12.1.10.3.1 Product launches
- 12.1.10.3.2 Expansions
- 12.1.10.3.3 Other developments
- 12.1.11 FUJI ELECTRIC CO., LTD.
- 12.1.11.1 Business overview
- 12.1.11.2 Products/Services/Solutions offered
- 12.1.11.3 Recent developments
- 12.1.11.3.1 Other developments
- 12.1.12 SGB SMIT
- 12.1.12.1 Business overview
- 12.1.12.2 Products/Services/Solutions offered
- 12.1.12.3 Recent developments
- 12.1.12.3.1 Deals
- 12.1.13 WEG
- 12.1.13.1 Business overview
- 12.1.13.2 Products/Services/Solutions offered
- 12.1.13.3 Recent developments
- 12.1.13.3.1 Deals
- 12.1.13.3.2 Expansions
- 12.1.13.3.3 Other developments
- 12.1.14 TRANSFORMERS AND RECTIFIERS (INDIA) LIMITED
- 12.1.14.1 Business overview
- 12.1.14.2 Products/Services/Solutions offered
- 12.1.15 NIAGARA POWER TRANSFORMER LLC
- 12.1.15.1 Business overview
- 12.1.15.2 Products/Services/Solutions offered
- 12.1.16 LS ELECTRIC CO., LTD.
- 12.1.16.1 Business overview
- 12.1.16.2 Products/Services/Solutions offered
- 12.1.16.3 Recent developments
- 12.1.16.3.1 Deals
- 12.1.16.3.2 Expansions
- 12.1.16.3.3 Other development
- 12.1.17 HAMMOND POWER SOLUTIONS
- 12.1.17.1 Business overview
- 12.1.17.2 Products/Services/Solutions offered
- 12.1.18 DAELIM TRANSFORMER
- 12.1.18.1 Business overview
- 12.1.18.2 Products/Services/Solutions offered
- 12.1.19 BEST TRANSFORMER
- 12.1.19.1 Business overview
- 12.1.19.2 Products/Solutions/Services offered
- 12.1.20 WILSON POWER SOLUTIONS LTD.
- 12.1.20.1 Business overview
- 12.1.20.2 Products/Services/Solutions offered
- 12.1.20.3 Recent developments
- 12.1.20.3.1 Other developments
- 12.1.1 SIEMENS ENERGY
- 12.2 OTHER PLAYERS
- 12.2.1 ORMAZABAL
- 12.2.2 ABC TRANSFORMERS (P) LTD.
- 12.2.3 VIJAY POWER
- 12.2.4 JSHP TRANSFORMER
- 12.2.5 CHINT GROUP
13 APPENDIX
- 13.1 INSIGHTS FROM INDUSTRY EXPERTS
- 13.2 DISCUSSION GUIDE
- 13.3 KNOWLEDGESTORE: MARKETSANDMARKETS' SUBSCRIPTION PORTAL
- 13.4 CUSTOMIZATION OPTIONS
- 13.5 RELATED REPORTS
- 13.6 AUTHOR DETAILS
List of Tables
- TABLE 1 POWER TRANSFORMER MARKET: RISK ASSESSMENT
- TABLE 2 POWER TRANSFORMER MARKET SNAPSHOT
- TABLE 3 POWER TRANSFORMER MARKET: IMPACT OF PORTER'S FIVE FORCES
- TABLE 4 LIST OF KEY CONFERENCES AND EVENTS, 2024
- TABLE 5 POWER TRANSFORMER MARKET: ROLE OF COMPANIES IN ECOSYSTEM
- TABLE 6 LIST OF PATENTS, 2021-2025
- TABLE 7 IMPORT DATA FOR HS CODE 850423-COMPLIANT PRODUCTS, BY COUNTRY, 2022-2024 (USD THOUSAND)
- TABLE 8 IMPORT DATA FOR HS CODE 850434-COMPLIANT PRODUCTS, BY COUNTRY, 2022-2024 (USD THOUSAND)
- TABLE 9 EXPORT DATA FOR HS CODE 850423-COMPLIANT PRODUCTS, BY COUNTRY, 2022-2024 (USD THOUSAND)
- TABLE 10 EXPORT DATA FOR HS CODE 850434-COMPLIANT PRODUCTS, BY COUNTRY, 2022-2024 (USD THOUSAND)
- TABLE 11 INDICATIVE PRICING ANALYSIS, BY POWER RATING
- TABLE 12 AVERAGE SELLING PRICE TREND, BY REGION, 2020-2024 (USD THOUSAND/UNIT)
- TABLE 13 MFN TARIFF FOR HS CODE 850423-COMPLIANT LIQUID DIELECTRIC TRANSFORMERS OF >10,000 KVA, 2024
- TABLE 14 NORTH AMERICA: LIST OF REGULATORY BODIES, GOVERNMENT AGENCIES, AND OTHER ORGANIZATIONS
- TABLE 15 EUROPE: LIST OF REGULATORY BODIES, GOVERNMENT AGENCIES, AND OTHER ORGANIZATIONS
- TABLE 16 ASIA PACIFIC: LIST OF REGULATORY BODIES, GOVERNMENT AGENCIES, AND OTHER ORGANIZATIONS
- TABLE 17 ROW: LIST OF REGULATORY BODIES, GOVERNMENT AGENCIES, AND OTHER ORGANIZATIONS
- TABLE 18 CODES AND REGULATIONS
- TABLE 19 INFLUENCE OF KEY STAKEHOLDERS ON BUYING PROCESS FOR TOP THREE END USERS
- TABLE 20 KEY BUYING CRITERIA FOR TOP THREE END USERS
- TABLE 21 US-ADJUSTED RECIPROCAL TARIFF RATES
- TABLE 22 EXPECTED CHANGE IN PRICES AND LIKELY IMPACT ON END-USE APPLICATIONS DUE TO TARIFF
- TABLE 23 POWER TRANSFORMER MARKET, BY POWER RATING, 2020-2024 (USD MILLION)
- TABLE 24 POWER TRANSFORMER MARKET, BY POWER RATING, 2025-2030 (USD MILLION)
- TABLE 25 UP TO 60 MVA: POWER TRANSFORMER MARKET, BY REGION, 2020-2024 (USD MILLION)
- TABLE 26 UP TO 60 MVA: POWER TRANSFORMER MARKET, BY REGION, 2025-2030 (USD MILLION)
- TABLE 27 61-600 MVA: POWER TRANSFORMER MARKET, BY REGION, 2020-2024 (USD MILLION)
- TABLE 28 61-600 MVA: POWER TRANSFORMER MARKET, BY REGION, 2025-2030 (USD MILLION)
- TABLE 29 ABOVE 600 MVA: POWER TRANSFORMER MARKET, BY REGION, 2020-2024 (USD MILLION)
- TABLE 30 ABOVE 600 MVA: POWER TRANSFORMER MARKET, BY REGION, 2025-2030 (USD MILLION)
- TABLE 31 POWER TRANSFORMER MARKET, BY COOLING TYPE, 2020-2024 (USD MILLION)
- TABLE 32 POWER TRANSFORMER MARKET, BY COOLING TYPE, 2025-2030 (USD MILLION)
- TABLE 33 OIL-COOLED: POWER TRANSFORMER MARKET, BY REGION, 2020-2024 (USD MILLION)
- TABLE 34 OIL-COOLED: POWER TRANSFORMER MARKET, BY REGION, 2025-2030 (USD MILLION)
- TABLE 35 AIR-COOLED: POWER TRANSFORMER MARKET, BY REGION, 2020-2024 (USD MILLION)
- TABLE 36 AIR-COOLED: POWER TRANSFORMER MARKET, BY REGION, 2025-2030 (USD MILLION)
- TABLE 37 POWER TRANSFORMER MARKET, BY PHASE, 2020-2024 (USD MILLION)
- TABLE 38 POWER TRANSFORMER MARKET, BY PHASE, 2025-2030 (USD MILLION)
- TABLE 39 SINGLE-PHASE: POWER TRANSFORMER MARKET, BY REGION, 2020-2024 (USD MILLION)
- TABLE 40 SINGLE-PHASE: POWER TRANSFORMER MARKET, BY REGION, 2025-2030 (USD MILLION)
- TABLE 41 THREE-PHASE: POWER TRANSFORMER MARKET, BY REGION, 2020-2024 (USD MILLION)
- TABLE 42 THREE-PHASE: POWER TRANSFORMER MARKET, BY REGION, 2025-2030 (USD MILLION)
- TABLE 43 POWER TRANSFORMER MARKET, BY END USER, 2020-2024 (USD MILLION)
- TABLE 44 POWER TRANSFORMER MARKET, BY END USER, 2025-2030 (USD MILLION)
- TABLE 45 UTILITIES: POWER TRANSFORMER MARKET, BY REGION, 2020-2024 (USD MILLION)
- TABLE 46 UTILITIES: POWER TRANSFORMER MARKET, BY REGION, 2025-2030 (USD MILLION)
- TABLE 47 RESIDENTIAL & COMMERCIAL: POWER TRANSFORMER MARKET, BY REGION, 2020-2024 (USD MILLION)
- TABLE 48 RESIDENTIAL & COMMERCIAL: POWER TRANSFORMER MARKET, BY REGION, 2025-2030 (USD MILLION)
- TABLE 49 INDUSTRIAL: POWER TRANSFORMER MARKET, BY REGION, 2020-2024 (USD MILLION)
- TABLE 50 INDUSTRIAL: POWER TRANSFORMER MARKET, BY REGION, 2025-2030 (USD MILLION)
- TABLE 51 INDUSTRIAL: POWER TRANSFORMER MARKET, BY INDUSTRY, 2020-2024 (USD MILLION)
- TABLE 52 INDUSTRIAL: POWER TRANSFORMER MARKET, BY INDUSTRY, 2025-2030 (USD MILLION)
- TABLE 53 POWER TRANSFORMER MARKET, BY REGION, 2020-2024 (USD MILLION)
- TABLE 54 POWER TRANSFORMER MARKET, BY REGION, 2025-2030 (USD MILLION)
- TABLE 55 POWER TRANSFORMER MARKET, BY REGION, 2020-2024 (UNITS)
- TABLE 56 POWER TRANSFORMER MARKET, BY REGION, 2025-2030 (UNITS)
- TABLE 57 NORTH AMERICA: POWER TRANSFORMER MARKET, BY POWER RATING, 2020-2024 (USD MILLION)
- TABLE 58 NORTH AMERICA: POWER TRANSFORMER MARKET, BY POWER RATING, 2025-2030 (USD MILLION)
- TABLE 59 NORTH AMERICA: POWER TRANSFORMER MARKET, BY PHASE, 2020-2024 (USD MILLION)
- TABLE 60 NORTH AMERICA: POWER TRANSFORMER MARKET, BY PHASE, 2025-2030 (USD MILLION)
- TABLE 61 NORTH AMERICA: POWER TRANSFORMER MARKET, BY COOLING TYPE, 2020-2024 (USD MILLION)
- TABLE 62 NORTH AMERICA: POWER TRANSFORMER MARKET, BY COOLING TYPE, 2025-2030 (USD MILLION)
- TABLE 63 NORTH AMERICA: POWER TRANSFORMER MARKET, BY END USER, 2020-2024 (USD MILLION)
- TABLE 64 NORTH AMERICA: POWER TRANSFORMER MARKET, BY END USER, 2025-2030 (USD MILLION)
- TABLE 65 NORTH AMERICA: POWER TRANSFORMER MARKET, BY COUNTRY, 2020-2024 (USD MILLION)
- TABLE 66 NORTH AMERICA: POWER TRANSFORMER MARKET, BY COUNTRY, 2025-2030 (USD MILLION)
- TABLE 67 US: POWER TRANSFORMER MARKET, BY POWER RATING, 2020-2024 (USD MILLION)
- TABLE 68 US: POWER TRANSFORMER MARKET, BY POWER RATING, 2025-2030 (USD MILLION)
- TABLE 69 CANADA: POWER TRANSFORMER MARKET, BY POWER RATING, 2020-2024 (USD MILLION)
- TABLE 70 CANADA: POWER TRANSFORMER MARKET, BY POWER RATING, 2025-2030 (USD MILLION)
- TABLE 71 MEXICO: POWER TRANSFORMER MARKET, BY POWER RATING, 2020-2024 (USD MILLION)
- TABLE 72 MEXICO: POWER TRANSFORMER MARKET, BY POWER RATING, 2025-2030 (USD MILLION)
- TABLE 73 EUROPE: POWER TRANSFORMER MARKET, BY POWER RATING, 2020-2024 (USD MILLION)
- TABLE 74 EUROPE: POWER TRANSFORMER MARKET, BY POWER RATING, 2025-2030 (USD MILLION)
- TABLE 75 EUROPE: POWER TRANSFORMER MARKET, BY PHASE, 2020-2024 (USD MILLION)
- TABLE 76 EUROPE: POWER TRANSFORMER MARKET, BY PHASE, 2025-2030 (USD MILLION)
- TABLE 77 EUROPE: POWER TRANSFORMER MARKET, BY COOLING TYPE, 2020-2024 (USD MILLION)
- TABLE 78 EUROPE: POWER TRANSFORMER MARKET, BY COOLING TYPE, 2025-2030 (USD MILLION)
- TABLE 79 EUROPE: POWER TRANSFORMER MARKET, BY END USER, 2020-2024 (USD MILLION)
- TABLE 80 EUROPE: POWER TRANSFORMER MARKET, BY END USER, 2025-2030 (USD MILLION)
- TABLE 81 EUROPE: POWER TRANSFORMER MARKET, BY COUNTRY, 2020-2024 (USD MILLION)
- TABLE 82 EUROPE: POWER TRANSFORMER MARKET, BY COUNTRY, 2025-2030 (USD MILLION)
- TABLE 83 GERMANY: POWER TRANSFORMER MARKET, BY POWER RATING, 2020-2024 (USD MILLION)
- TABLE 84 GERMANY: POWER TRANSFORMER MARKET, BY POWER RATING, 2025-2030 (USD MILLION)
- TABLE 85 UK: POWER TRANSFORMER MARKET, BY POWER RATING, 2020-2024 (USD MILLION)
- TABLE 86 UK: POWER TRANSFORMER MARKET, BY POWER RATING, 2025-2030 (USD MILLION)
- TABLE 87 ITALY: POWER TRANSFORMER MARKET, BY POWER RATING, 2020-2024 (USD MILLION)
- TABLE 88 ITALY: POWER TRANSFORMER MARKET, BY POWER RATING, 2025-2030 (USD MILLION)
- TABLE 89 FRANCE: POWER TRANSFORMER MARKET, BY POWER RATING, 2020-2024 (USD MILLION)
- TABLE 90 FRANCE: POWER TRANSFORMER MARKET, BY POWER RATING, 2025-2030 (USD MILLION)
- TABLE 91 SPAIN: POWER TRANSFORMER MARKET, BY POWER RATING, 2020-2024 (USD MILLION)
- TABLE 92 SPAIN: POWER TRANSFORMER MARKET, BY POWER RATING, 2025-2030 (USD MILLION)
- TABLE 93 REST OF EUROPE: POWER TRANSFORMER MARKET, BY POWER RATING, 2020-2024 (USD MILLION)
- TABLE 94 REST OF EUROPE: POWER TRANSFORMER MARKET, BY POWER RATING, 2025-2030 (USD MILLION)
- TABLE 95 ASIA PACIFIC: POWER TRANSFORMER MARKET, BY POWER RATING, 2020-2024 (USD MILLION)
- TABLE 96 ASIA PACIFIC: POWER TRANSFORMER MARKET, BY POWER RATING, 2025-2030 (USD MILLION)
- TABLE 97 ASIA PACIFIC: POWER TRANSFORMER MARKET, BY PHASE, 2020-2024 (USD MILLION)
- TABLE 98 ASIA PACIFIC: POWER TRANSFORMER MARKET, BY PHASE, 2025-2030 (USD MILLION)
- TABLE 99 ASIA PACIFIC: POWER TRANSFORMER MARKET, BY COOLING TYPE, 2020-2024 (USD MILLION)
- TABLE 100 ASIA PACIFIC: POWER TRANSFORMER MARKET, BY COOLING TYPE, 2025-2030 (USD MILLION)
- TABLE 101 ASIA PACIFIC: POWER TRANSFORMER MARKET, BY END USER, 2020-2024 (USD MILLION)
- TABLE 102 ASIA PACIFIC: POWER TRANSFORMER MARKET, BY END USER, 2025-2030 (USD MILLION)
- TABLE 103 ASIA PACIFIC: POWER TRANSFORMER MARKET, BY COUNTRY, 2020-2024 (USD MILLION)
- TABLE 104 ASIA PACIFIC: POWER TRANSFORMER MARKET, BY COUNTRY, 2025-2030 (USD MILLION)
- TABLE 105 CHINA: POWER TRANSFORMER MARKET, BY POWER RATING, 2020-2024 (USD MILLION)
- TABLE 106 CHINA: POWER TRANSFORMER MARKET, BY POWER RATING, 2025-2030 (USD MILLION)
- TABLE 107 INDIA: POWER TRANSFORMER MARKET, BY POWER RATING, 2020-2024 (USD MILLION)
- TABLE 108 INDIA: POWER TRANSFORMER MARKET, BY POWER RATING, 2025-2030 (USD MILLION)
- TABLE 109 JAPAN: POWER TRANSFORMER MARKET, BY POWER RATING, 2020-2024 (USD MILLION)
- TABLE 110 JAPAN: POWER TRANSFORMER MARKET, BY POWER RATING, 2025-2030 (USD MILLION)
- TABLE 111 SOUTH KOREA: POWER TRANSFORMER MARKET, BY POWER RATING, 2020-2024 (USD MILLION)
- TABLE 112 SOUTH KOREA: POWER TRANSFORMER MARKET, BY POWER RATING, 2025-2030 (USD MILLION)
- TABLE 113 AUSTRALIA: POWER TRANSFORMER MARKET, BY POWER RATING, 2020-2024 (USD MILLION)
- TABLE 114 AUSTRALIA: POWER TRANSFORMER MARKET, BY POWER RATING, 2025-2030 (USD MILLION)
- TABLE 115 REST OF ASIA PACIFIC: POWER TRANSFORMER MARKET, BY POWER RATING 2020-2024 (USD MILLION)
- TABLE 116 REST OF ASIA PACIFIC: POWER TRANSFORMER MARKET, BY POWER RATING, 2025-2030 (USD MILLION)
- TABLE 117 MIDDLE EAST & AFRICA: POWER TRANSFORMER MARKET, BY POWER RATING, 2020-2024 (USD MILLION)
- TABLE 118 MIDDLE EAST & AFRICA: POWER TRANSFORMER MARKET, BY POWER RATING, 2025-2030 (USD MILLION)
- TABLE 119 MIDDLE EAST & AFRICA: POWER TRANSFORMER MARKET, BY PHASE, 2020-2024 (USD MILLION)
- TABLE 120 MIDDLE EAST & AFRICA: POWER TRANSFORMER MARKET, BY PHASE, 2025-2030 (USD MILLION)
- TABLE 121 MIDDLE EAST & AFRICA: POWER TRANSFORMER MARKET, BY COOLING TYPE, 2020-2024 (USD MILLION)
- TABLE 122 MIDDLE EAST & AFRICA: POWER TRANSFORMER MARKET, BY COOLING TYPE, 2025-2030 (USD MILLION)
- TABLE 123 MIDDLE EAST & AFRICA: POWER TRANSFORMER MARKET, BY END USER, 2020-2024 (USD MILLION)
- TABLE 124 MIDDLE EAST & AFRICA: POWER TRANSFORMER MARKET, BY END USER, 2025-2030 (USD MILLION)
- TABLE 125 MIDDLE EAST & AFRICA: POWER TRANSFORMER MARKET, BY COUNTRY, 2020-2024 (USD MILLION)
- TABLE 126 MIDDLE EAST & AFRICA: POWER TRANSFORMER MARKET, BY COUNTRY, 2025-2030 (USD MILLION)
- TABLE 127 GCC: POWER TRANSFORMER MARKET, BY POWER RATING, 2020-2024 (USD MILLION)
- TABLE 128 GCC: POWER TRANSFORMER MARKET, BY POWER RATING, 2025-2030 (USD MILLION)
- TABLE 129 GCC: POWER TRANSFORMER MARKET, BY COUNTRY, 2020-2024 (USD MILLION)
- TABLE 130 GCC: POWER TRANSFORMER MARKET, BY COUNTRY, 2025-2030 (USD MILLION)
- TABLE 131 SAUDI ARABIA: POWER TRANSFORMER MARKET, BY POWER RATING, 2020-2024 (USD MILLION)
- TABLE 132 SAUDI ARABIA: POWER TRANSFORMER MARKET, BY POWER RATING, 2025-2030 (USD MILLION)
- TABLE 133 UAE: POWER TRANSFORMER MARKET, BY POWER RATING, 2020-2024 (USD MILLION)
- TABLE 134 UAE: POWER TRANSFORMER MARKET, BY POWER RATING, 2025-2030 (USD MILLION)
- TABLE 135 REST OF GCC COUNTRIES: POWER TRANSFORMER MARKET, BY POWER RATING, 2020-2024 (USD MILLION)
- TABLE 136 REST OF GCC COUNTRIES: POWER TRANSFORMER MARKET, BY POWER RATING, 2025-2030 (USD MILLION)
- TABLE 137 SOUTH AFRICA: POWER TRANSFORMER MARKET, BY POWER RATING, 2020-2024 (USD MILLION)
- TABLE 138 SOUTH AFRICA: POWER TRANSFORMER MARKET, BY POWER RATING, 2025-2030 (USD MILLION)
- TABLE 139 REST OF MIDDLE EAST & AFRICA: POWER TRANSFORMER MARKET, BY POWER RATING, 2020-2024 (USD MILLION)
- TABLE 140 REST OF MIDDLE EAST & AFRICA: POWER TRANSFORMER MARKET, BY POWER RATING, 2025-2030 (USD MILLION)
- TABLE 141 SOUTH AMERICA: POWER TRANSFORMER MARKET, BY POWER RATING, 2020-2024 (USD MILLION)
- TABLE 142 SOUTH AMERICA: POWER TRANSFORMER MARKET, BY POWER RATING, 2025-2030 (USD MILLION)
- TABLE 143 SOUTH AMERICA: POWER TRANSFORMER MARKET, BY PHASE, 2020-2024 (USD MILLION)
- TABLE 144 SOUTH AMERICA: POWER TRANSFORMER MARKET, BY PHASE, 2025-2030 (USD MILLION)
- TABLE 145 SOUTH AMERICA: POWER TRANSFORMER MARKET, BY COOLING TYPE, 2020-2024 (USD MILLION)
- TABLE 146 SOUTH AMERICA: POWER TRANSFORMER MARKET, BY COOLING TYPE, 2025-2030 (USD MILLION)
- TABLE 147 SOUTH AMERICA: POWER TRANSFORMER MARKET, BY END USER, 2020-2024 (USD MILLION)
- TABLE 148 SOUTH AMERICA: POWER TRANSFORMER MARKET, BY END USER, 2025-2030 (USD MILLION)
- TABLE 149 SOUTH AMERICA: POWER TRANSFORMER MARKET, BY COUNTRY, 2020-2024 (USD MILLION)
- TABLE 150 SOUTH AMERICA: POWER TRANSFORMER MARKET, BY COUNTRY, 2025-2030 (USD MILLION)
- TABLE 151 BRAZIL: POWER TRANSFORMER MARKET, BY POWER RATING, 2020-2024 (USD MILLION)
- TABLE 152 BRAZIL: POWER TRANSFORMER MARKET, BY POWER RATING, 2025-2030 (USD MILLION)
- TABLE 153 ARGENTINA: POWER TRANSFORMER MARKET, BY POWER RATING, 2020-2024 (USD MILLION)
- TABLE 154 ARGENTINA: POWER TRANSFORMER MARKET, BY POWER RATING, 2025-2030 (USD MILLION)
- TABLE 155 REST OF SOUTH AMERICA: POWER TRANSFORMER MARKET, BY POWER RATING, 2020-2024 (USD MILLION)
- TABLE 156 REST OF SOUTH AMERICA: POWER TRANSFORMER MARKET, BY POWER RATING, 2025-2030 (USD MILLION)
- TABLE 157 POWER TRANSFORMER MARKET: OVERVIEW OF STRATEGIES ADOPTED BY KEY PLAYERS, JANUARY 2022- JULY 2025
- TABLE 158 POWER TRANSFORMER MARKET: DEGREE OF COMPETITION, 2024
- TABLE 159 POWER TRANSFORMER MARKET: REGION FOOTPRINT
- TABLE 160 POWER TRANSFORMER MARKET: PHASE FOOTPRINT
- TABLE 161 POWER TRANSFORMER MARKET: POWER RATING FOOTPRINT
- TABLE 162 POWER TRANSFORMER MARKET: COOLING TYPE FOOTPRINT
- TABLE 163 POWER TRANSFORMER MARKET: END USER FOOTPRINT
- TABLE 164 POWER TRANSFORMER MARKET: DETAILED LIST OF KEY STARTUPS/SMES
- TABLE 165 POWER TRANSFORMER MARKET: COMPETITIVE BENCHMARKING OF KEY STARTUPS/SMES
- TABLE 166 POWER TRANSFORMER MARKET: PRODUCT LAUNCHES, JANUARY 2022-JULY 2025
- TABLE 167 POWER TRANSFORMER MARKET: DEALS, JANUARY 2022-JULY 2025
- TABLE 168 POWER TRANSFORMER MARKET: EXPANSIONS, JANUARY 2022-JULY 2025
- TABLE 169 POWER TRANSFORMER MARKET: OTHER DEVELOPMENTS, JANUARY 2022-JULY 2025
- TABLE 170 SIEMENS ENERGY: COMPANY OVERVIEW
- TABLE 171 SIEMENS ENERGY: PRODUCTS/SERVICES/SOLUTIONS OFFERED
- TABLE 172 SIEMENS ENERGY: PRODUCT LAUNCHES
- TABLE 173 SIEMENS ENERGY: DEALS
- TABLE 174 SIEMENS ENERGY: EXPANSIONS
- TABLE 175 SIEMENS ENERGY: OTHER DEVELOPMENTS
- TABLE 176 HITACHI ENERGY LTD.: COMPANY OVERVIEW
- TABLE 177 HITACHI ENERGY LTD.: PRODUCTS/SERVICES/SOLUTIONS OFFERED
- TABLE 178 HITACHI ENERGY LTD.: PRODUCT LAUNCHES
- TABLE 179 HITACHI ENERGY LTD.: DEALS
- TABLE 180 HITACHI ENERGY LTD.: EXPANSIONS
- TABLE 181 HITACHI ENERGY LTD.: OTHER DEVELOPMENTS
- TABLE 182 TOSHIBA ENERGY SYSTEMS & SOLUTIONS CORPORATION: COMPANY OVERVIEW
- TABLE 183 TOSHIBA ENERGY SYSTEMS & SOLUTIONS CORPORATION: PRODUCTS/SERVICES/SOLUTIONS OFFERED
- TABLE 184 TOSHIBA ENERGY SYSTEMS & SOLUTIONS CORPORATION: OTHER DEVELOPMENTS
- TABLE 185 HD HYUNDAI ELECTRIC CO., LTD.: COMPANY OVERVIEW
- TABLE 186 HD HYUNDAI ELECTRIC CO., LTD.: PRODUCTS/SERVICES/SOLUTIONS OFFERED
- TABLE 187 HD HYUNDAI ELECTRIC CO., LTD.: OTHER DEVELOPMENTS
- TABLE 188 GE VERNOVA: COMPANY OVERVIEW
- TABLE 189 GE VERNOVA: PRODUCTS/SERVICES/SOLUTIONS OFFERED
- TABLE 190 GE VERNOVA: PRODUCT LAUNCHES
- TABLE 191 GE VERNOVA: DEALS
- TABLE 192 GE VERNOVA: EXPANSIONS
- TABLE 193 GE VERNOVA: OTHER DEVELOPMENTS
- TABLE 194 SCHNEIDER ELECTRIC: COMPANY OVERVIEW
- TABLE 195 CHNEIDER ELECTRIC: PRODUCTS/SERVICES/SOLUTIONS OFFERED
- TABLE 196 SCHNEIDER ELECTRIC: PRODUCT LAUNCHES
- TABLE 197 SCHNEIDER ELECTRIC: DEALS
- TABLE 198 SCHNEIDER ELECTRIC: EXPANSIONS
- TABLE 199 SCHNEIDER ELECTRIC: OTHER DEVELOPMENTS
- TABLE 200 CG POWER AND INDUSTRIAL SOLUTIONS LTD.: COMPANY OVERVIEW
- TABLE 201 CG POWER AND INDUSTRIAL SOLUTIONS LTD.: PRODUCTS/SERVICES/SOLUTIONS OFFERED
- TABLE 202 CG POWER & INDUSTRIAL SOLUTIONS LTD.: DEALS
- TABLE 203 CG POWER & INDUSTRIAL SOLUTIONS LTD.: EXPANSIONS
- TABLE 204 CG POWER & INDUSTRIAL SOLUTIONS LTD.: OTHER DEVELOPMENTS
- TABLE 205 MITSUBISHI ELECTRIC CORPORATION: COMPANY OVERVIEW
- TABLE 206 MITSUBISHI ELECTRIC CORPORATION: PRODUCTS/SERVICES/SOLUTIONS OFFERED
- TABLE 207 MITSUBISHI ELECTRIC CORPORATION: DEALS
- TABLE 208 MITSUBISHI ELECTRIC CORPORATION: OTHER DEVELOPMENTS
- TABLE 209 HYUSONG HEAVY INDUSTRIES: COMPANY OVERVIEW
- TABLE 210 HYOSUNG HEAVY INDUSTRIES: PRODUCTS/SERVICES/SOLUTIONS OFFERED
- TABLE 211 HYUSONG HEAVY INDUSTRIES: EXPANSIONS
- TABLE 212 HYOSUNG HEAVY INDUSTRIES: OTHER DEVELOPMENTS
- TABLE 213 BHARAT HEAVY ELECTRICALS LIMITED: COMPANY OVERVIEW
- TABLE 214 BHARAT HEAVY ELECTRICALS LIMITED: PRODUCTS/SERVICES/SOLUTIONS OFFERED
- TABLE 215 BHARAT HEAVY ELECTRICALS LIMITED: PRODUCT LAUNCHES
- TABLE 216 BHARAT HEAVY ELECTRICALS LIMITED: EXPANSIONS
- TABLE 217 BHARAT HEAVY ELECTRICALS LIMITED: OTHER DEVELOPMENTS
- TABLE 218 FUJI ELECTRIC CO., LTD.: COMPANY OVERVIEW
- TABLE 219 FUJI ELECTRIC CO., LTD.: PRODUCTS/SERVICES/SOLUTIONS OFFERED
- TABLE 220 FUJI ELECTRIC CO., LTD.: OTHER DEVELOPMENTS
- TABLE 221 SBG SMIT: COMPANY OVERVIEW
- TABLE 222 SBG SMIT: PRODUCTS/SERVICES/SOLUTIONS OFFERED
- TABLE 223 SGB SMIT: DEALS
- TABLE 224 WEG: COMPANY OVERVIEW
- TABLE 225 WEG: PRODUCTS/SERVICES/SOLUTIONS OFFERED
- TABLE 226 WEG: DEALS
- TABLE 227 WEG: EXPANSIONS
- TABLE 228 WEG: OTHER DEVELOPMENTS
- TABLE 229 TRANSFORMERS AND RECTIFIERS (INDIA) LIMITED: COMPANY OVERVIEW
- TABLE 230 TRANSFORMERS AND RECTIFIERS (INDIA) LIMITED: PRODUCTS/SERVICES/SOLUTIONS OFFERED
- TABLE 231 NIAGARA POWER TRANSFORMER LLC: COMPANY OVERVIEW
- TABLE 232 NIAGARA POWER TRANSFORMER LLC: PRODUCTS/SERVICES/SOLUTIONS OFFERED
- TABLE 233 LS ELECTRIC CO., LTD.: COMPANY OVERVIEW
- TABLE 234 LS ELECTRIC CO., LTD.: PRODUCTS/SERVICES/SOLUTIONS OFFERED
- TABLE 235 LS ELECTRIC CO., LTD.: DEALS
- TABLE 236 LS ELECTRIC CO., LTD.: EXPANSIONS
- TABLE 237 LS ELECTRIC CO., LTD.: OTHER DEVELOPMENTS
- TABLE 238 HAMMOND POWER SOLUTIONS: COMPANY OVERVIEW
- TABLE 239 HAMMOND POWER SOLUTIONS: PRODUCTS/SERVICES/SOLUTIONS OFFERED
- TABLE 240 DAELIM TRANSFORMER: COMPANY OVERVIEW
- TABLE 241 DAELIM TRANSFORMER: PRODUCTS/SERVICES/SOLUTIONS OFFERED
- TABLE 242 BEST TRANSFORMER: COMPANY OVERVIEW
- TABLE 243 BEST TRANSFORMER: PRODUCTS/SOLUTIONS/SERVICES OFFERED
- TABLE 244 WILSON POWER SOLUTIONS LTD.: COMPANY OVERVIEW
- TABLE 245 WILSON POWER SOLUTIONS LTD.: PRODUCTS/SERVICES/SOLUTIONS OFFERED
- TABLE 246 WILSON POWER SOLUTIONS LTD.: OTHER DEVELOPMENTS
List of Figures
- FIGURE 1 POWER TRANSFORMER MARKET SEGMENTATION
- FIGURE 2 POWER TRANSFORMER MARKET: RESEARCH DESIGN
- FIGURE 3 KEY METRICS CONSIDERED TO ANALYZE DEMAND FOR POWER TRANSFORMERS
- FIGURE 4 POWER TRANSFORMER MARKET: BOTTOM-UP APPROACH
- FIGURE 5 POWER TRANSFORMER MARKET: TOP-DOWN APPROACH
- FIGURE 6 KEY STEPS CONSIDERED TO ASSESS POWER TRANSFORMER SUPPLY
- FIGURE 7 POWER TRANSFORMER MARKET: SUPPLY-SIDE ANALYSIS
- FIGURE 8 POWER TRANSFORMER MARKET: DATA TRIANGULATION
- FIGURE 9 ASIA PACIFIC ACCOUNTED FOR LARGEST SHARE OF GLOBAL POWER TRANSFORMER MARKET IN 2024
- FIGURE 10 61-600 MVA SEGMENT TO ACCOUNT FOR LARGEST SHARE OF POWER TRANSFORMER MARKET IN 2025
- FIGURE 11 THREE-PHASE SEGMENT TO DOMINATE POWER TRANSFORMER MARKET FROM 2025 TO 2030
- FIGURE 12 OIL-COOLED SEGMENT TO ACCOUNT FOR LARGER SHARE OF POWER TRANSFORMER MARKET IN 2030
- FIGURE 13 UTILITIES TO BE LARGEST END USER OF POWER TRANSFORMER DURING FORECAST PERIOD
- FIGURE 14 INCREASING POWER DEMAND DUE TO RAPID URBANIZATION FUELING MARKET GROWTH
- FIGURE 15 ASIA PACIFIC TO EXHIBIT HIGHEST CAGR IN POWER TRANSFORMER MARKET DURING FORECAST PERIOD
- FIGURE 16 CHINA ACCOUNTED FOR LARGEST SHARE OF POWER TRANSFORMER MARKET IN ASIA PACIFIC
- FIGURE 17 61-600 MVA SEGMENT TO ACCOUNT FOR LARGEST SHARE OF POWER TRANSFORMER MARKET IN 2030
- FIGURE 18 THREE-PHASE SEGMENT TO ACCOUNT FOR LARGER MARKET SHARE IN 2030
- FIGURE 19 OIL-COOLED SEGMENT TO ACCOUNT FOR LARGER MARKET SHARE DURING FORECAST PERIOD
- FIGURE 20 UTILITIES TO ACCOUNT FOR LARGEST MARKET SHARE IN 2030
- FIGURE 21 POWER TRANSFORMER MARKET: DRIVERS, RESTRAINTS, OPPORTUNITIES, AND CHALLENGES
- FIGURE 22 ELECTRICITY DEMAND, BY REGION, 2019-2025
- FIGURE 23 GLOBAL INVESTMENT IN CLEAN ENERGY AND FOSSIL FUELS, 2015-2025
- FIGURE 24 GLOBAL INVESTMENTS IN GRIDS & STORAGE, 2015-2025
- FIGURE 25 POWER TRANSFORMER MARKET: PORTER'S FIVE FORCES ANALYSIS
- FIGURE 26 SUPPLY CHAIN ANALYSIS
- FIGURE 27 POWER TRANSFORMER MARKET: ECOSYSTEM ANALYSIS
- FIGURE 28 POWER TRANSFORMER MARKET: PATENTS GRANTED AND APPLIED, 2014-2024
- FIGURE 29 IMPORT SCENARIO FOR HS CODE 850423-COMPLIANT PRODUCTS, BY COUNTRY, 2022-2024 (USD THOUSAND)
- FIGURE 30 IMPORT SCENARIO FOR HS CODE 850434-COMPLIANT PRODUCTS, BY COUNTRY, 2022-2024 (USD THOUSAND)
- FIGURE 31 EXPORT SCENARIO FOR HS CODE 850423-COMPLIANT PRODUCTS, BY COUNTRY, 2022-2024 (USD THOUSAND)
- FIGURE 32 EXPORT SCENARIO FOR HS CODE 850434-COMPLIANT PRODUCTS, BY COUNTRY, 2022-2024 (USD THOUSAND)
- FIGURE 33 AVERAGE SELLING PRICE TREND, BY REGION, 2020-2024
- FIGURE 34 INVESTMENT AND FUNDING SCENARIO
- FIGURE 35 TRENDS/DISRUPTIONS IMPACTING CUSTOMER BUSINESS
- FIGURE 36 INFLUENCE OF KEY STAKEHOLDERS ON BUYING PROCESS FOR TOP THREE END USERS
- FIGURE 37 KEY BUYING CRITERIA FOR TOP THREE END USERS
- FIGURE 38 IMPACT OF GEN AI/AI ON POWER TRANSFORMER MARKET, BY REGION
- FIGURE 39 POWER TRANSFORMER MARKET SHARE, BY POWER RATING, 2024
- FIGURE 40 OIL-COOLED SEGMENT ACCOUNTED FOR LARGER SHARE OF POWER TRANSFORMER MARKET IN 2024
- FIGURE 41 POWER TRANSFORMER MARKET SHARE, BY PHASE, 2024
- FIGURE 42 POWER TRANSFORMER MARKET SHARE, BY END USER, 2024
- FIGURE 43 POWER TRANSFORMER MARKET SHARE, BY REGION, 2024
- FIGURE 44 ASIA PACIFIC TO REGISTER HIGHEST CAGR IN POWER TRANSFORMER MARKET FROM 2025 TO 2030
- FIGURE 45 EUROPE: POWER TRANSFORMER MARKET SNAPSHOT
- FIGURE 46 ASIA PACIFIC: POWER TRANSFORMER MARKET SNAPSHOT
- FIGURE 47 POWER TRANSFORMER MARKET SHARE ANALYSIS, 2024
- FIGURE 48 REVENUE ANALYSIS OF TOP FIVE PLAYERS, 2020-2024
- FIGURE 49 COMPANY VALUATION
- FIGURE 50 FINANCIAL METRICS
- FIGURE 51 BRAND/PRODUCT COMPARISON
- FIGURE 52 POWER TRANSFORMER MARKET: COMPANY EVALUATION MATRIX (KEY PLAYERS), 2024
- FIGURE 53 POWER TRANSFORMER MARKET: COMPANY FOOTPRINT
- FIGURE 54 POWER TRANSFORMER MARKET: COMPANY EVALUATION MATRIX (STARTUPS/SMES), 2024
- FIGURE 55 SIEMENS ENERGY: COMPANY SNAPSHOT
- FIGURE 56 HITACHI ENERGY LTD.: COMPANY SNAPSHOT
- FIGURE 57 TOSHIBA ENERGY SYSTEMS & SOLUTIONS CORPORATION: COMPANY SNAPSHOT
- FIGURE 58 HD HYUNDAI ELECTRIC CO., LTD.: COMPANY SNAPSHOT
- FIGURE 59 GE VERNOVA: COMPANY SNAPSHOT
- FIGURE 60 SCHNEIDER ELECTRIC: COMPANY SNAPSHOT
- FIGURE 61 CG POWER AND INDUSTRIAL SOLUTIONS LTD.: COMPANY SNAPSHOT
- FIGURE 62 MITSUBISHI ELECTRIC CORPORATION: COMPANY SNAPSHOT
- FIGURE 63 HYOSUNG HEAVY INDUSTRIES: COMPANY SNAPSHOT
- FIGURE 64 BHARAT HEAVY ELECTRICALS LIMITED: COMPANY SNAPSHOT
- FIGURE 65 FUJI ELECTRIC CO., LTD.: COMPANY SNAPSHOT
- FIGURE 66 WEG: COMPANY SNAPSHOT
- FIGURE 67 TRANSFORMERS AND RECTIFIERS (INDIA) LIMITED: COMPANY SNAPSHOT
- FIGURE 68 LS ELECTRIC CO., LTD.: COMPANY SNAPSHOT
- FIGURE 69 HAMMOND POWER SOLUTIONS: COMPANY SNAPSHOT

