PUBLISHER: MarketsandMarkets | PRODUCT CODE: 2174829

PUBLISHER: MarketsandMarkets | PRODUCT CODE: 2174829
Smart Gas Meter Market by Technology (AMR, AMI), Type (Smart Ultrasonic Gas Meter, Smart Diaphragm Gas Meter), Component (Hardware, Software), End User (Residential, Commercial, Industrial), and Region- Global Forecast to 2031
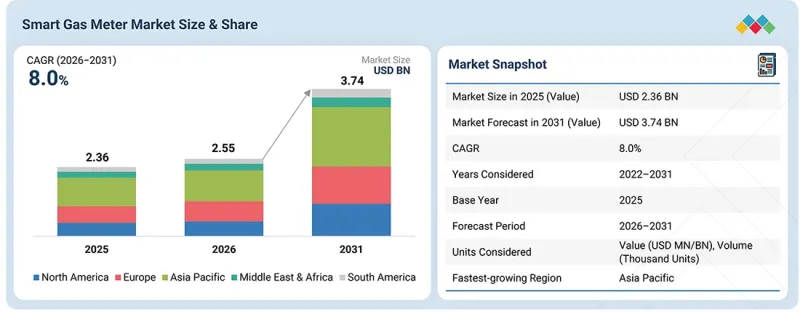
The global smart gas meter market is projected to grow from USD 2.55 billion in 2026 to USD 3.74 billion by 2031, at a CAGR of 8.0%. The market growth is fueled by several factors, including mandatory meter replacement programs, efforts by utility companies to reduce meter reading and operating costs, and a rising demand for remote monitoring of consumption. Manufacturers are innovating new types of meters, such as smart diaphragm, ultrasonic, and solid-state meters, which offer improved measurement accuracy, remote data collection capabilities, and enhanced safety features.
| Scope of the Report | |
|---|---|
| Years Considered for the Study | 2022-2031 |
| Base Year | 2025 |
| Forecast Period | 2026-2031 |
| Units Considered | Value (USD Million/Billion), Volume (Thousand Units) |
| Segments | by Technology, Type, Component, End User, and Region |
| Regions covered | North America, South America, Europe, Asia Pacific, and the Middle East & Africa |
The increasing implementation of Advanced Metering Infrastructure (AMI), two-way communication, remote shutoff options, and IoT-enabled monitoring is further driving the demand for connected smart gas metering solutions. Investments in communication technologies such as RF, cellular, NB-IoT, and LTE-M are transforming gas meters into connected endpoints within digitally managed utility networks. Additionally, advancements in cloud-based meter data management, remote diagnostics, predictive analytics, and automated detection of leaks and abnormal consumption are helping utilities improve network visibility and reduce the need for field service. As utilities continue to upgrade aging infrastructure and expand digital metering initiatives, smart gas meters are expected to play a critical role in enhancing billing accuracy, operational efficiency, safety, and customer transparency.
"Smart diaphragm gas meters segment captured the largest market share in 2025"
By type, the smart diaphragm gas meters segment held the largest share in the smart gas meter market in 2025. This dominance is driven by their cost-effectiveness, proven reliability, and widespread suitability for residential and light commercial applications. Key growth drivers include the large-scale replacement of aging mechanical meters, rising demand for accurate billing and remote monitoring in residential buildings, and the increasing adoption of AMI-enabled diaphragm meters that support two-way communication and remote shutoff capabilities. Furthermore, the growing need for dependable gas supply and improved safety in residential and commercial settings continues to support the segment's expansion.
"Industrial segment to record a commendable CAGR in the smart gas meter market during the forecast period"
By end user, the industrial segment is anticipated to witness high growth from 2026 to 2031, owing to the increasing adoption of connected metering solutions to gain better visibility into gas consumption, monitor operations, and manage energy use across their facilities. Smart gas meters can provide automated consumption data, interval measurements, remote monitoring, and communication with utility or industrial management systems, reducing the need for manual data collection. In commercial and industrial applications, Landis+Gyr offers the M225 RF Commercial & Industrial Gas Communications Module, which provides two-way AMI communication for large diaphragm gas meters and supports the transmission of consumption and interval data. These solutions enable utilities and large gas consumers to access more frequent consumption information while supporting capacity planning and flexible rate structures. Industrial applications also create opportunities for meters with features such as leak detection, abnormal-flow monitoring, remote shutoff, and integration with broader energy-management platforms. Manufacturers can therefore expand their market opportunities by offering scalable smart gas metering solutions designed for different consumption levels, communication requirements, and network configurations.
"Asia Pacific to record the highest CAGR in the smart gas meter market from 2026 to 2031"
By region, Asia Pacific is anticipated to witness the highest growth rate during the forecast period, driven by the increasing modernization of gas distribution networks, expansion of urban gas infrastructure, and growing adoption of smart metering technologies across major economies. Utilities are deploying connected gas meters to improve consumption visibility, automate meter reading, enhance billing accuracy, and support remote monitoring of distributed gas networks. China, Japan, and India are among the key markets contributing to regional adoption, supported by investments in digital utility infrastructure, energy efficiency, and advanced metering technologies. The increasing deployment of IoT-enabled meters and communication technologies such as NB-IoT, cellular, and RF is further supporting the transition from conventional meters to remotely connected solutions. Regional utilities and gas distributors are also seeking smart meters with capabilities such as leak detection, abnormal-consumption monitoring, remote operations, and integration with utility data-management platforms.
Breakdown of Primaries
In-depth interviews have been conducted with various key industry participants, subject-matter experts, C-level executives of key market players, and industry consultants, among other experts, to obtain and verify critical qualitative and quantitative information and assess future market prospects. The distribution of primary interviews is as follows:
By Company Type: Tier 1 - 57%, Tier 2 - 29%, and Tier 3 - 14%
By Designation: C-Level Executives - 35%, Directors - 20%, and Others - 45%
By Region: North America - 20%, Europe - 15%, Asia Pacific - 30%, the Middle East & Africa - 25%, and South America - 10%
Note: The tiers of the companies are defined based on their total revenues as of 2023. Tier 1: > USD 1 billion, Tier 2: From USD 500 million to USD 1 billion, and Tier 3: < USD 500 million
Apator S.A. (Poland), Diehl Stiftung & Co. KG (Germany), Honeywell International Inc. (US), Itron Inc. (US), Landis+Gyr (Switzerland), Sensus (Xylem) (US), EDMI Limited (Singapore), Chongqing Shancheng Gas Equipment Co., Ltd. (China), Dongfa (Group) (China), and Raychem RPG (India) are some of the key players in the smart gas meter market. The study includes an in-depth competitive analysis of these key players, with their company profiles, recent developments, and key market strategies.
Research Coverage
The report defines, describes, and forecasts the smart gas meter market by type (smart ultrasonic gas meters, smart diaphragm gas meters), technology (automatic meter reading [AMR], advanced metering infrastructure [AMI]), component (hardware, software), end user (residential, commercial, industrial), and region (North America, Europe, Asia Pacific, Middle East & Africa, and South America). The scope of the report covers detailed information regarding the major factors, such as drivers, restraints, challenges, and opportunities, influencing the growth of the market. A detailed analysis of the key industry players has been done to provide insights into their business overview, solutions, and services; key strategies; Contracts, partnerships, agreements, mergers and acquisitions; and recent developments associated with the market.
Key Benefits of Buying the Report
- Market Dynamics: Key drivers (Rapid utility digitalization, Mounting deployment of AMR and AMI technologies, High demand for remote monitoring and accurate billing), restraints (High upfront deployment and infrastructure costs, Integration complexity with legacy utility systems, Limited connectivity in remote and low-density areas), opportunities (Emergence of ultrasonic and solid-state smart gas meters, Availability of retrofit communication modules for existing meters), and challenges (Cybersecurity and data-privacy requirements, Compatibility issues with legacy gas infrastructure, Fragmentation of communication standards) influence the growth of the smart gas meter market.
- Product Development/ Innovation: New technology is redefining the market and will eventually be designed to use superior digital tools enabled by automation, influencing reliability and economic viability. AI predictive maintenance systems and big data analytics, for example, will monitor large streams of sensor data to attempt to predict failures, which will allow condition-based interventions to avert costly downtime and preserve the life of the meter.
- Market Development: In April 2025, Landis+Gyr and Centrica Smart Meter Assets (a subsidiary of Centrica plc, which includes British Gas) signed a new three-year agreement to supply smart electricity and gas meters. This extends a collaboration that has spanned more than a decade. The partnership aims to further advance the UK's smart energy transition, ensuring households and businesses benefit from improved energy management.
- Market Diversification: In September 2025, Honeywell announced the completion of its acquisition of Air Products' liquefied natural gas (LNG) process technology and equipment business for USD 1.81. This further expands the comprehensive suite of top-tier solutions Honeywell offers its customers to manage their energy transformation journey.
- Competitive Assessment: In-depth assessment of market shares, growth strategies, and service offerings of leading players such as Apator S.A. (Poland), Diehl Stiftung & Co. KG (Germany), Honeywell International Inc. (US), Itron Inc. (United States), Landis+Gyr (Switzerland), Sensus (Xylem) (US), EDMI Limited (Singapore), Chongqing Shancheng Gas Equipment Co., Ltd. (China), Dongfa (Group) (China), Raychem RPG (India), CHINT Group (China), ZENNER International GmbH & Co. KG (Germany), Master Meter (US), and Aclara Technologies (US).
TABLE OF CONTENTS
1 INTRODUCTION
- 1.1 STUDY OBJECTIVES
- 1.2 MARKET DEFINITION
- 1.3 STUDY SCOPE.
- 1.3.1 MARKETS COVERED AND REGIONAL SCOPE
- 1.3.2 INCLUSIONS AND EXCLUSIONS
- 1.3.3 YEARS CONSIDERED
- 1.4 CURRENCY CONSIDERED
- 1.5 UNIT CONSIDERED
- 1.6 LIMITATIONS
- 1.7 STAKEHOLDERS
- 1.8 SUMMARY OF CHANGES
2 EXECUTIVE SUMMARY
- 2.1 MARKET HIGHLIGHTS AND KEY INSIGHTS
- 2.2 KEY MARKET PARTICIPANTS: MAPPING OF STRATEGIC DEVELOPMENTS
- 2.3 DISRUPTIVE TRENDS IN SMART GAS METER MARKET
- 2.4 HIGH-GROWTH SEGMENTS
- 2.5 REGIONAL SNAPSHOT: MARKET SIZE, GROWTH RATE, AND FORECAST
3 PREMIUM INSIGHTS
- 3.1 ATTRACTIVE OPPORTUNITIES FOR SMART GAS METER MARKET PLAYERS
- 3.2 SMART GAS METER MARKET, BY TECHNOLOGY & REGION
- 3.3 SMART GAS MARKET, BY TECHNOLOGY
- 3.4 SMART GAS METER MARKET, BY TYPE
- 3.5 SMART GAS METER MARKET, BY COMPONENT
- 3.6 SMART GAS METER MARKET, BY END USER
- 3.7 SMART GAS METER MARKET, BY COUNTRY
4 MARKET OVERVIEW
- 4.1 INTRODUCTION
- 4.2 MARKET DYNAMICS
- 4.2.1 DRIVERS
- 4.2.1.1 Digitalization of distribution grids and optimization of network operations
- 4.2.1.2 Benefits of deploying AMI
- 4.2.1.3 Increasing investment in digital technologies for gas network monitoring and data analytics
- 4.2.2 RESTRAINTS
- 4.2.2.1 Potential health concerns associated with RF exposure
- 4.2.2.2 Concerns pertaining to data privacy & security and consumer health
- 4.2.2.3 High upfront cost for smart gas meter infrastructure
- 4.2.3 OPPORTUNITIES
- 4.2.3.1 Expanding opportunities through gas network modernization and smart meter integration
- 4.2.3.2 Integration of AI into smart gas meter data management and utility operations
- 4.2.4 CHALLENGES
- 4.2.4.1 Complexities associated with smart gas meter integration
- 4.2.1 DRIVERS
- 4.3 INTERCONNECTED MARKETS AND CROSS-SECTOR OPPORTUNITIES
- 4.4 STRATEGIC MOVES BY TIER 1/2/3 PLAYERS
5 INDUSTRY TRENDS
- 5.1 PORTER'S FIVE FORCES ANALYSIS
- 5.1.1 THREAT OF NEW ENTRANTS
- 5.1.2 THREAT OF SUBSTITUTES
- 5.1.3 BARGAINING POWER OF SUPPLIERS
- 5.1.4 BARGAINING POWER OF BUYERS
- 5.1.5 INTENSITY OF COMPETITIVE RIVALRY
- 5.2 MACROECONOMIC OUTLOOK
- 5.2.1 INTRODUCTION
- 5.2.2 GDP TRENDS AND FORECAST
- 5.2.3 TRENDS IN GLOBAL NATURAL GAS DISTRIBUTION AND UTILITIES INDUSTRIES
- 5.2.4 TRENDS IN GLOBAL SMART UTILITY AND IOT INDUSTRIES
- 5.3 VALUE CHAIN ANALYSIS
- 5.4 ECOSYSTEM ANALYSIS
- 5.5 PRICING ANALYSIS
- 5.5.1 PRICING RANGE OF SMART GAS METER, BY TYPE, 2025
- 5.5.2 AVERAGE SELLING PRICE TREND OF SMART GAS METER, BY REGION, 2023-2025
- 5.6 TRADE ANALYSIS
- 5.6.1 IMPORT SCENARIO (HS CODE 902810)
- 5.6.2 EXPORT SCENARIO (HS CODE 902810)
- 5.7 KEY CONFERENCES AND EVENTS, 2026-2027
- 5.8 TRENDS/DISRUPTIONS IMPACTING CUSTOMER BUSINESS
- 5.9 INVESTMENT AND FUNDING SCENARIO
- 5.10 CASE STUDY ANALYSIS
- 5.10.1 POLAND'S EGAZOMIERZ PROJECT ACCELERATES SMART GAS METER DEPLOYMENT
- 5.10.2 PEOPLES NATURAL GAS DEPLOYS ITRON INTELIS' SMART GAS METERS TO IMPROVE OPERATIONAL EFFICIENCY AND VISIBILITY
- 5.10.3 ENERGY ASSETS AND HONEYWELL COLLABORATE TO UPGRADE GAS METERS IN UK TO ENABLE REMOTE DATA TRANSMISSION
- 5.11 IMPACT OF US TARIFF - SMART GAS METER MARKET
- 5.11.1 INTRODUCTION
- 5.11.2 KEY TARIFF RATES
- 5.11.3 PRICE IMPACT ANALYSIS
- 5.11.4 IMPACT ON COUNTRY/REGION
- 5.11.4.1 North America
- 5.11.4.2 Europe
- 5.11.4.3 Asia Pacific
- 5.11.4.4 RoW
- 5.11.5 IMPACT ON COMPONENTS
6 REGULATORY LANDSCAPE
- 6.1 REGIONAL REGULATIONS AND COMPLIANCE
- 6.2 REGULATORY BODIES, GOVERNMENT AGENCIES, AND OTHER ORGANIZATIONS
- 6.2.1 INDUSTRY STANDARDS
7 CUSTOMER LANDSCAPE AND BUYER BEHAVIOR
- 7.1 DECISION-MAKING PROCESS
- 7.1.1 APPLICATION NEED AND METERING REQUIREMENT ANALYSIS
- 7.1.2 METER TECHNOLOGY AND TECHNICAL FEASIBILITY ASSESSMENT
- 7.1.3 COMMUNICATION, CONNECTIVITY, AND INTEGRATION ASSESSMENT
- 7.1.4 TOTAL COST OF OWNERSHIP AND BUSINESS CASE EVALUATION
- 7.1.5 INSTALLATION FEASIBILITY AND FIELD DEPLOYMENT ASSESSMENT
- 7.1.6 PROCUREMENT COST AND COMMERCIAL TERMS EVALUATION
- 7.2 KEY STAKEHOLDERS INVOLVED IN BUYING PROCESS AND THEIR EVALUATION CRITERIA
- 7.2.1 KEY STAKEHOLDERS IN BUYING PROCESS
- 7.2.2 BUYING CRITERIA
- 7.3 ADOPTION BARRIERS AND INTERNAL CHALLENGES
- 7.3.1 HIGH UPFRONT COST AND RETROFIT EXPENDITURE
- 7.3.2 LIMITED LONG-TERM OPERATIONAL TRACK RECORD
- 7.3.3 RELIABILITY AND BATTERY LIFE CONCERNS
- 7.3.4 CONNECTIVITY AND NETWORK COVERAGE LIMITATIONS
- 7.3.5 COMPLEX INTEGRATION WITH EXISTING UTILITY INFRASTRUCTURE
- 7.3.6 CYBERSECURITY AND DATA PRIVACY RISKS
- 7.3.7 INSTALLATION AND WORKFORCE CHALLENGES
- 7.3.8 REGULATORY, SAFETY, AND CERTIFICATION REQUIREMENTS
- 7.3.9 CUSTOMER ACCEPTANCE AND PRIVACY CONCERNS
- 7.3.10 UNCERTAINTY REGARDING RETURN ON INVESTMENT
- 7.3.11 LIMITED SUPPORTING DIGITAL INFRASTRUCTURE
- 7.3.12 SUPPLY CHAIN AND COMPONENT AVAILABILITY
- 7.4 UNMET NEEDS OF VARIOUS END USERS
- 7.5 MARKET PROFITABILITY
8 TECHNOLOGICAL ADVANCEMENTS, AI-DRIVEN IMPACT, PATENTS, INNOVATIONS, AND FUTURE APPLICATIONS
- 8.1 KEY TECHNOLOGIES
- 8.1.1 ADVANCED ULTRASONIC GAS METERING
- 8.1.2 SMART DIAPHRAGM METERING AND DIGITAL INDEXING
- 8.1.3 ADVANCED METERING INFRASTRUCTURE AND LOW-POWER CONNECTIVITY
- 8.1.4 INTEGRATED SAFETY SENSORS AND REMOTE SHUTOFF
- 8.2 COMPLEMENTARY TECHNOLOGIES
- 8.2.1 METER DATA MANAGEMENT AND UTILITY ANALYTICS
- 8.2.2 CLOUD COMPUTING AND IOT PLATFORMS
- 8.2.3 CYBERSECURITY AND SECURE COMMUNICATIONS
- 8.2.4 SENSORS AND EDGE COMPUTING
- 8.3 ADJACENT TECHNOLOGIES
- 8.3.1 SMART ELECTRICITY AND WATER METERING
- 8.3.2 GAS NETWORK DIGITALIZATION AND SCADA
- 8.3.3 GAS LEAK DETECTION AND METHANE MONITORING
- 8.3.4 HYDROGEN AND RENEWABLE GAS METERING
- 8.4 TECHNOLOGY ROADMAP
- 8.4.1 ELECTRONIC METER READING AND AMR
- 8.4.2 AMI AND TWO-WAY CONNECTED METERING
- 8.4.3 ULTRASONIC AND SOLID-STATE MEASUREMENT
- 8.4.4 INTEGRATED SAFETY AND REMOTE OPERATION
- 8.4.5 DIGITALIZED AND ANALYTICS-ENABLED GAS METERING
- 8.4.6 AI-ENABLED PREDICTIVE AND ADAPTIVE METERING
- 8.4.7 CYBERSECURE AND INTEROPERABLE SMART METERING
- 8.4.8 HYDROGEN-READY AND MULTI-GAS METERING
- 8.4.9 FULLY INTEGRATED INTELLIGENT GAS-METERING PLATFORMS
- 8.5 PATENT ANALYSIS
- 8.6 FUTURE APPLICATIONS
- 8.7 IMPACT OF AI/GEN AI ON SMART GAS METER MARKET
- 8.7.1 TOP USE CASES AND MARKET POTENTIAL
- 8.7.2 BEST PRACTICES FOLLOWED BY MANUFACTURERS/OEMS IN SMART GAS METER MARKET
- 8.7.3 CASE STUDIES RELATED TO AI/GEN AI IMPLEMENTATION IN SMART GAS METER MARKET
- 8.7.4 INTERCONNECTED ECOSYSTEMS AND IMPACT ON MARKET PLAYERS
- 8.7.5 CLIENTS' READINESS TO ADOPT AI/GEN AI-INTEGRATED SMART GAS METERS
9 SMART GAS METER MARKET, BY TECHNOLOGY
- 9.1 INTRODUCTION
- 9.2 AMI
- 9.2.1 GROWING NEED FOR ACCURATE METER READING AND INCREASING SPENDING ON SMART GRID PROJECTS TO BOOST DEMAND
- 9.3 AMR
- 9.3.1 INCREASING DEMAND FOR COST-EFFECTIVE SMART GAS METERS TO FUEL MARKET GROWTH
10 SMART GAS METER MARKET, BY TYPE
- 10.1 INTRODUCTION
- 10.2 SMART ULTRASONIC GAS METER
- 10.2.1 RISING NEED FOR COMPACT-SIZED AND DURABLE SMART GAS METERS TO STIMULATE DEMAND
- 10.3 SMART DIAPHRAGM GAS METER
- 10.3.1 INCREASING NUMBER OF RESIDENTIAL & LIGHT COMMERCIAL BUILDINGS TO FUEL MARKET GROWTH
11 SMART GAS METER MARKET, BY COMPONENT
- 11.1 INTRODUCTION
- 11.2 HARDWARE
- 11.2.1 INCREASING DEMAND FOR PRECISE SMART GAS METER OPERATIONS TO SUPPORT MARKET GROWTH
- 11.3 SOFTWARE
- 11.3.1 RISING UTILITY INVESTMENTS IN DIGITAL INFRASTRUCTURE AND GRID MODERNIZATION TO SUPPORT MARKET GROWTH
12 SMART GAS METER MARKET, BY END USER
- 12.1 INTRODUCTION
- 12.2 RESIDENTIAL
- 12.2.1 INCREASING FOCUS ON ENERGY EFFICIENCY TO FOSTER MARKET GROWTH
- 12.3 COMMERCIAL
- 12.3.1 RAPID URBANIZATION AND EXPANSION OF COMMERCIAL GAS PIPELINE NETWORKS TO CREATE GROWTH OPPORTUNITIES
- 12.4 INDUSTRIAL
- 12.4.1 GROWING FOCUS OF INDUSTRIAL USERS ON ENERGY-EFFICIENT OPERATIONS TO FOSTER MARKET GROWTH
13 SMART GAS METER MARKET, BY REGION
- 13.1 INTRODUCTION
- 13.2 NORTH AMERICA
- 13.2.1 US
- 13.2.1.1 Investments in development of smart metering infrastructure to drive market
- 13.2.2 CANADA
- 13.2.2.1 Growing by to spur market growth
- 13.2.3 MEXICO
- 13.2.3.1 Government-led infrastructure modernization initiatives to offer lucrative growth opportunities
- 13.2.1 US
- 13.3 EUROPE
- 13.3.1 GERMANY
- 13.3.1.1 Digitalization of energy infrastructure to fuel market growth
- 13.3.2 FRANCE
- 13.3.2.1 Need to modernize aging infrastructure to spur demand
- 13.3.3 UK
- 13.3.3.1 IoT and communication technology advancements to offer lucrative growth opportunities
- 13.3.4 SPAIN
- 13.3.4.1 Initiatives to modernize energy infrastructure to support market growth
- 13.3.5 ITALY
- 13.3.5.1 Renewable hydrogen initiatives to offer lucrative growth opportunities
- 13.3.6 POLAND
- 13.3.6.1 Rising consumer awareness about energy efficiency to spike demand
- 13.3.7 REST OF EUROPE
- 13.3.1 GERMANY
- 13.4 ASIA PACIFIC
- 13.4.1 CHINA
- 13.4.1.1 High investments in IoT to drive market
- 13.4.2 AUSTRALIA
- 13.4.2.1 Rising emphasis on achieving net-zero emissions target to spur market growth
- 13.4.3 JAPAN
- 13.4.3.1 Shifting focus toward renewable energy and electric vehicles to foster market growth
- 13.4.4 INDIA
- 13.4.4.1 Significant focus on enhancing renewable energy capacity to boost demand
- 13.4.5 SOUTH KOREA
- 13.4.5.1 Rising emphasis on achieving carbon neutrality during power generation to fuel market growth
- 13.4.6 REST OF ASIA PACIFIC
- 13.4.1 CHINA
- 13.5 MIDDLE EAST & AFRICA
- 13.5.1 GCC
- 13.5.1.1 Saudi Arabia
- 13.5.1.1.1 Increasing focus on grid modernization to facilitate market growth
- 13.5.1.2 UAE
- 13.5.1.2.1 Smart Dubai initiatives to offer lucrative growth opportunities
- 13.5.1.1 Saudi Arabia
- 13.5.2 ISRAEL
- 13.5.2.1 Favorable government subsidies to boost demand
- 13.5.3 SOUTH AFRICA
- 13.5.3.1 Rapid advances in smart utility infrastructure to accelerate demand
- 13.5.4 TURKEY
- 13.5.4.1 Developing power metering infrastructure to fuel market growth
- 13.5.5 REST OF MIDDLE EAST & AFRICA
- 13.5.1 GCC
- 13.6 SOUTH AMERICA
- 13.6.1 BRAZIL
- 13.6.1.1 Modernization of T&D systems to fuel market growth
- 13.6.2 ARGENTINA
- 13.6.2.1 Shift toward digitalization to boost demand
- 13.6.3 CHILE
- 13.6.3.1 Aging infrastructure and push for data-driven decision-making to fuel market growth
- 13.6.4 REST OF SOUTH AMERICA
- 13.6.1 BRAZIL
14 COMPETITIVE LANDSCAPE
- 14.1 OVERVIEW
- 14.2 KEY PLAYER COMPETITIVE STRATEGIES/RIGHT TO WIN, JANUARY 2023-AUGUST 2026
- 14.3 MARKET SHARE ANALYSIS, 2025
- 14.4 SEGMENTAL REVENUE ANALYSIS, 2021-2025
- 14.5 BRAND/PRODUCT COMPARISON
- 14.5.1 LANDIS+GYR GROUP AG (SWITZERLAND)
- 14.5.2 ITRON, INC. (US)
- 14.5.3 HONEYWELL INTERNATIONAL INC. (US)
- 14.5.4 APATOR S.A. (POLAND)
- 14.5.5 DIEHL METERING (GERMANY)
- 14.6 COMPANY VALUATION AND FINANCIAL METRICS
- 14.7 COMPANY EVALUATION MATRIX: KEY PLAYERS, 2025
- 14.7.1 STARS
- 14.7.2 EMERGING LEADERS
- 14.7.3 PERVASIVE PLAYERS
- 14.7.4 PARTICIPANTS
- 14.7.5 COMPANY FOOTPRINT: KEY PLAYERS, 2025
- 14.7.5.1 Company footprint
- 14.7.5.2 Region footprint
- 14.7.5.3 Technology footprint
- 14.7.5.4 Type footprint
- 14.7.5.5 End user footprint
- 14.8 COMPETITIVE EVALUATION MATRIX: STARTUPS/SMES, 2025
- 14.8.1 PROGRESSIVE COMPANIES
- 14.8.2 RESPONSIVE COMPANIES
- 14.8.3 DYNAMIC COMPANIES
- 14.8.4 STARTING BLOCKS
- 14.8.5 COMPETITIVE BENCHMARKING: STARTUPS/SMES, 2025
- 14.8.5.1 Detailed list of key startups/SMEs
- 14.8.5.2 Competitive benchmarking of key startups/SMEs
- 14.9 COMPETITIVE SCENARIO
- 14.9.1 PRODUCT LAUNCHES
- 14.9.2 DEALS
- 14.9.3 EXPANSIONS
- 14.9.4 OTHER DEVELOPMENTS
15 COMPANY PROFILES
- 15.1 KEY PLAYERS
- 15.1.1 APATOR S.A.
- 15.1.1.1 Business overview
- 15.1.1.2 Products/Solutions/Services offered
- 15.1.1.3 Recent developments
- 15.1.1.3.1 Deals
- 15.1.1.3.2 Expansions
- 15.1.1.3.3 Other developments
- 15.1.1.4 MnM view
- 15.1.1.4.1 Key strengths/Right to win
- 15.1.1.4.2 Strategic choices
- 15.1.1.4.3 Weaknesses/Competitive threats
- 15.1.2 DIEHL STIFTUNG & CO. KG
- 15.1.2.1 Business overview
- 15.1.2.2 Products/Solutions/Services offered
- 15.1.2.3 Recent developments
- 15.1.2.3.1 Product launches
- 15.1.2.3.2 Deals
- 15.1.2.3.3 Expansions
- 15.1.2.4 MnM view
- 15.1.2.4.1 Key strengths/Right to win
- 15.1.2.4.2 Strategic choices
- 15.1.2.4.3 Weaknesses/Competitive threats
- 15.1.3 HONEYWELL INTERNATIONAL INC.
- 15.1.3.1 Business overview
- 15.1.3.2 Products/Solutions/Services offered
- 15.1.3.3 Recent developments
- 15.1.3.3.1 Product launches
- 15.1.3.3.2 Deals
- 15.1.3.4 MnM view
- 15.1.3.4.1 Key strengths/Right to win
- 15.1.3.4.2 Strategic choices
- 15.1.3.4.3 Weaknesses/Competitive threats
- 15.1.4 ITRON INC.
- 15.1.4.1 Business overview
- 15.1.4.2 Products/Solutions/Services offered
- 15.1.4.3 Recent developments
- 15.1.4.3.1 Product launches
- 15.1.4.3.2 Deals
- 15.1.4.3.3 Expansions
- 15.1.4.3.4 Other developments
- 15.1.4.4 MnM view
- 15.1.4.4.1 Key strengths/Right to win
- 15.1.4.4.2 Strategic choices
- 15.1.4.4.3 Weaknesses/Competitive threats
- 15.1.5 LANDIS+GYR
- 15.1.5.1 Business overview
- 15.1.5.2 Products/Solutions/Services offered
- 15.1.5.3 Recent developments
- 15.1.5.3.1 Product launches
- 15.1.5.3.2 Deals
- 15.1.5.3.3 Other developments
- 15.1.5.4 MnM view
- 15.1.5.4.1 Key strengths/Right to win
- 15.1.5.4.2 Strategic choices
- 15.1.5.4.3 Weaknesses and competitive threats
- 15.1.6 SENSUS (XYLEM)
- 15.1.6.1 Business overview
- 15.1.6.2 Products/Solutions/Services offered
- 15.1.6.3 Recent developments
- 15.1.6.3.1 Product launches
- 15.1.6.3.2 Deals
- 15.1.6.3.3 Expansions
- 15.1.7 EDMI LIMITED
- 15.1.7.1 Business overview
- 15.1.7.2 Products/Solutions/Services offered
- 15.1.7.3 Recent developments
- 15.1.7.3.1 Deals
- 15.1.8 CHONGQING SHANCHENG GAS EQUIPMENT CO., LTD.
- 15.1.8.1 Business overview
- 15.1.8.2 Products/Solutions/Services offered
- 15.1.9 DONGFA (GROUP)
- 15.1.9.1 Business overview
- 15.1.9.2 Products/Solutions/Services offered
- 15.1.10 RAYCHEM RPG PRIVATE LIMITED
- 15.1.10.1 Business overview
- 15.1.10.2 Products/Solutions/Services offered
- 15.1.11 CHINT GROUP
- 15.1.11.1 Business overview
- 15.1.11.2 Products/Solutions/Services offered
- 15.1.11.2.1 Product launches
- 15.1.11.2.2 Deals
- 15.1.11.2.3 Other developments
- 15.1.12 ZENNER INTERNATIONAL GMBH & CO. KG
- 15.1.12.1 Business overview
- 15.1.12.2 Products/Solutions/Services offered
- 15.1.12.3 Recent developments
- 15.1.12.3.1 Product launches
- 15.1.12.3.2 Source: Company Website and Press Releases
- 15.1.12.3.3 Deals
- 15.1.13 MASTER METER INC.
- 15.1.13.1 Business overview
- 15.1.13.2 Products/Solutions/Services offered
- 15.1.14 ACLARA TECHNOLOGIES
- 15.1.14.1 Business overview
- 15.1.14.2 Products/Solutions/Services offered
- 15.1.15 WASION HOLDINGS INTERNATIONAL
- 15.1.15.1 Business overview
- 15.1.15.2 Products/Solutions/Services offered
- 15.1.15.3 Recent developments
- 15.1.15.3.1 Product launches
- 15.1.15.3.2 Deals
- 15.1.15.3.3 Expansions
- 15.1.1 APATOR S.A.
- 15.2 OTHER PLAYERS
- 15.2.1 AICHITOKEIDENKI CORPORATION
- 15.2.2 PIETRO FIORENTINI S.P.A.
- 15.2.3 SECURE METERS LTD.
- 15.2.4 FUJITSU
- 15.2.5 SAGEMCOM
- 15.2.6 ADYA SMART METERING
- 15.2.7 ULTAN TECHNOLOGIES
- 15.2.8 POWERCOM
- 15.2.9 FLONIDAN
- 15.2.10 SNS TECHNOSYS
16 RESEARCH METHODOLOGY
- 16.1 RESEARCH DATA
- 16.2 SECONDARY AND PRIMARY RESEARCH
- 16.2.1 SECONDARY DATA
- 16.2.1.1 List of major secondary sources
- 16.2.1.2 Key data from secondary sources
- 16.2.2 PRIMARY DATA
- 16.2.2.1 List of primary interview participants
- 16.2.2.2 Key industry insights
- 16.2.2.3 Breakdown of primaries
- 16.2.2.4 Key data from primary sources
- 16.2.1 SECONDARY DATA
- 16.3 MARKET SIZE ESTIMATION
- 16.3.1 BOTTOM-UP APPROACH
- 16.3.2 TOP-DOWN APPROACH
- 16.4 MARKET FORECAST APPROACH
- 16.4.1 DEMAND-SIDE METRICS
- 16.4.1.1 Calculation for demand side
- 16.4.1.2 Assumptions for demand-side calculations
- 16.4.2 SUPPLY-SIDE ANALYSIS
- 16.4.2.1 Calculations for supply side
- 16.4.2.2 Assumptions for supply side
- 16.4.3 GROWTH FORECAST ASSUMPTIONS
- 16.4.1 DEMAND-SIDE METRICS
- 16.5 DATA TRIANGULATION
- 16.6 RESEARCH LIMITATIONS
- 16.7 RISK ASSESSMENT
17 APPENDIX
- 17.1 DISCUSSION GUIDE
- 17.2 KNOWLEDGESTORE: MARKETSANDMARKETS' SUBSCRIPTION PORTAL
- 17.3 CUSTOMIZATION OPTIONS
- 17.4 RELATED REPORTS
- 17.5 AUTHOR DETAILS
List of Tables
- TABLE 1 INTERCONNECTED MARKETS
- TABLE 2 KEY MOVES AND STRATEGIC FOCUS OF TIER 1/2/3 PLAYERS
- TABLE 3 IMPACT OF PORTER'S FIVE FORCES ANALYSIS
- TABLE 4 GDP PERCENTAGE CHANGE, BY COUNTRY, 2021-2029
- TABLE 5 ROLE OF COMPANIES IN SMART GAS METER MARKET ECOSYSTEM
- TABLE 6 PRICING RANGE OF SMART GAS METER TYPES, 2025 (USD)
- TABLE 7 REGION-WISE AVERAGE SELLING PRICE TREND OF SMART GAS METER, 2023-2025)
- TABLE 8 IMPORT DATA FOR HS CODE 902810-COMPLIANT PRODUCTS, BY COUNTRY, 2021-2025 (USD MN)
- TABLE 9 EXPORT DATA FOR HS CODE 902810-COMPLIANT PRODUCTS, BY COUNTRY, 2021-2025 (USD MN)
- TABLE 10 LIST OF KEY CONFERENCES AND EVENTS, 2026-2027
- TABLE 11 US-ADJUSTED RECIPROCAL TARIFF RATES, 2025
- TABLE 12 EXPECTED CHANGE IN PRICES AND LIKELY IMPACT ON SMART GAS METER COMPONENTS DUE TO TARIFF IMPACT
- TABLE 13 NORTH AMERICA: REGULATORY BODIES, GOVERNMENT AGENCIES, AND OTHER ORGANIZATIONS
- TABLE 14 SOUTH AMERICA: REGULATORY BODIES, GOVERNMENT AGENCIES, AND OTHER ORGANIZATIONS
- TABLE 15 ASIA PACIFIC: REGULATORY BODIES, GOVERNMENT AGENCIES, AND OTHER ORGANIZATIONS
- TABLE 16 EUROPE: REGULATORY BODIES, GOVERNMENT AGENCIES, AND OTHER ORGANIZATIONS
- TABLE 17 MIDDLE EAST & AFRICA: REGULATORY BODIES, GOVERNMENT AGENCIES, AND OTHER ORGANIZATIONS
- TABLE 18 KEY INDUSTRY STANDARDS FOR SMART GAS METER MARKET
- TABLE 19 INFLUENCE OF STAKEHOLDERS ON BUYING PROCESS, BY END USER (%)
- TABLE 20 BUYING CRITERIA, BY END USER
- TABLE 21 LIST OF KEY PATENTS, JANUARY 2025-NOVEMBER 2025
- TABLE 22 FUTURE APPLICATIONS
- TABLE 23 KEY USE CASES AND MARKET POTENTIAL
- TABLE 24 BEST PRACTICES FOLLOWED BY MAJOR COMPANIES
- TABLE 25 CASE STUDIES RELATED TO AI/GEN AI IMPLEMENTATION
- TABLE 26 INTERCONNECTED ECOSYSTEMS AND IMPACT ON PLAYERS SMART GAS METER MARKET PLAYERS
- TABLE 27 SMART GAS METER MARKET, BY TECHNOLOGY, 2022-2025 (USD MILLION)
- TABLE 28 SMART GAS METER MARKET, BY TECHNOLOGY, 2026-2031 (USD MILLION)
- TABLE 29 AMI: SMART GAS METER MARKET, BY REGION, 2022-2025 (USD MILLION)
- TABLE 30 AMI: SMART GAS METER MARKET, BY REGION, 2026-2031 (USD MILLION)
- TABLE 31 AMR: SMART GAS METER MARKET, BY REGION, 2022-2025 (USD MILLION)
- TABLE 32 AMR: SMART GAS METER MARKET, BY REGION, 2026-2031 (USD MILLION)
- TABLE 33 SMART GAS METER MARKET, BY TYPE, 2022-2025 (USD MILLION)
- TABLE 34 SMART GAS METER MARKET, BY TYPE, 2026-2031 (USD MILLION)
- TABLE 35 SMART ULTRASONIC GAS METER MARKET, BY REGION, 2022-2025 (USD MILLION)
- TABLE 36 SMART ULTRASONIC GAS METER MARKET, BY REGION, 2026-2031 (USD MILLION)
- TABLE 37 SMART DIAPHRAGM GAS METER MARKET, BY REGION, 2022-2025 (USD MILLION)
- TABLE 38 SMART DIAPHRAGM GAS METER MARKET: BY REGION, 2026-2031 (USD MILLION)
- TABLE 39 SMART GAS METER MARKET, BY COMPONENT, 2022-2025 (USD MILLION)
- TABLE 40 SMART GAS METER MARKET, BY COMPONENT, 2026-2031 (USD MILLION)
- TABLE 41 HARDWARE: SMART GAS METER MARKET, BY REGION, 2022-2025 (USD MILLION)
- TABLE 42 HARDWARE: SMART GAS METER MARKET, BY REGION, 2026-2031 (USD MILLION)
- TABLE 43 SOFTWARE: SMART GAS METER MARKET, BY REGION, 2022-2025 (USD MILLION)
- TABLE 44 SOFTWARE: SMART GAS METER MARKET, BY REGION, 2026-2031 (USD MILLION)
- TABLE 45 SMART GAS METER MARKET, BY END USER, 2022-2025 (USD MILLION)
- TABLE 46 SMART GAS METER MARKET, BY END USER, 2026-2031 (USD MILLION)
- TABLE 47 RESIDENTIAL: SMART GAS METER MARKET, BY REGION, 2022-2025 (USD MILLION)
- TABLE 48 RESIDENTIAL: SMART GAS METER MARKET, BY REGION, 2026-2031 (USD MILLION)
- TABLE 49 COMMERCIAL: SMART GAS METER MARKET, BY REGION, 2022-2025 (USD MILLION)
- TABLE 50 COMMERCIAL: SMART GAS METER MARKET, BY REGION, 2026-2031 (USD MILLION)
- TABLE 51 INDUSTRIAL: SMART GAS METER MARKET, BY REGION, 2022-2025 (USD MILLION)
- TABLE 52 INDUSTRIAL: SMART GAS METER MARKET, BY REGION, 2026-2031 (USD MILLION)
- TABLE 53 SMART GAS METER MARKET, BY REGION, 2022-2025 (THOUSAND UNITS)
- TABLE 54 SMART GAS METER MARKET, BY REGION, 2026-2031 (THOUSAND UNITS)
- TABLE 55 SMART GAS METER MARKET, BY REGION, 2022-2025 (USD MILLION)
- TABLE 56 SMART GAS METER MARKET, BY REGION, 2026-2031 (USD MILLION)
- TABLE 57 NORTH AMERICA: SMART GAS METER MARKET, BY TECHNOLOGY, 2022-2025 (USD MILLION)
- TABLE 58 NORTH AMERICA: SMART GAS METER MARKET, BY TECHNOLOGY, 2026-2031 (USD MILLION)
- TABLE 59 NORTH AMERICA: SMART GAS METER MARKET, BY TYPE, 2022-2025 (USD MILLION)
- TABLE 60 NORTH AMERICA: SMART GAS METER MARKET, BY TYPE, 2026-2031 (USD MILLION)
- TABLE 61 NORTH AMERICA: SMART GAS METER MARKET, BY COMPONENT, 2022-2025 (USD MILLION)
- TABLE 62 NORTH AMERICA: SMART GAS METER MARKET, BY COMPONENT, 2026-2031 (USD MILLION)
- TABLE 63 NORTH AMERICA: SMART GAS METER MARKET, BY END USER, 2022-2025 (USD MILLION)
- TABLE 64 NORTH AMERICA: SMART GAS METER MARKET, BY END USER, 2026-2031 (USD MILLION)
- TABLE 65 NORTH AMERICA: SMART GAS METER MARKET, BY COUNTRY, 2022-2025 (USD MILLION)
- TABLE 66 NORTH AMERICA: SMART GAS METER MARKET, BY COUNTRY, 2026-2031 (USD MILLION)
- TABLE 67 US: SMART GAS METER MARKET, BY TECHNOLOGY, 2022-2025 (USD MILLION)
- TABLE 68 US: SMART GAS METER MARKET, BY TECHNOLOGY, 2026-2031 (USD MILLION)
- TABLE 69 US: SMART GAS METER MARKET, BY END USER, 2022-2025 (USD MILLION)
- TABLE 70 US: SMART GAS METER MARKET, BY END USER, 2026-2031 (USD MILLION)
- TABLE 71 CANADA: SMART GAS METER MARKET, BY TECHNOLOGY, 2022-2025 (USD MILLION)
- TABLE 72 CANADA: SMART GAS METER MARKET, BY TECHNOLOGY, 2026-2031 (USD MILLION)
- TABLE 73 CANADA: SMART GAS METER MARKET, BY END USER, 2022-2025 (USD MILLION)
- TABLE 74 CANADA: SMART GAS METER MARKET, BY END USER, 2026-2031 (USD MILLION)
- TABLE 75 MEXICO: SMART GAS METER MARKET, BY TECHNOLOGY, 2022-2025 (USD MILLION)
- TABLE 76 MEXICO: SMART GAS METER MARKET, BY TECHNOLOGY, 2026-2031 (USD MILLION)
- TABLE 77 MEXICO: SMART GAS METER MARKET, BY END USER, 2022-2025 (USD MILLION)
- TABLE 78 MEXICO: SMART GAS METER MARKET, BY END USER, 2026-2031 (USD MILLION)
- TABLE 79 EUROPE: SMART GAS METER MARKET, BY TECHNOLOGY, 2022-2025 (USD MILLION)
- TABLE 80 EUROPE: SMART GAS METER MARKET, BY TECHNOLOGY, 2026-2031 (USD MILLION)
- TABLE 81 EUROPE: SMART GAS METER MARKET, BY TYPE, 2022-2025 (USD MILLION)
- TABLE 82 EUROPE : SMART GAS METER MARKET, BY TYPE, 2026-2031 (USD MILLION)
- TABLE 83 EUROPE: SMART GAS METER MARKET, BY COMPONENT, 2022-2025 (USD MILLION)
- TABLE 84 EUROPE: SMART GAS METER MARKET, BY COMPONENT, 2026-2031 (USD MILLION)
- TABLE 85 EUROPE: SMART GAS METER MARKET, BY END USER, 2022-2025 (USD MILLION)
- TABLE 86 EUROPE: SMART GAS METER MARKET, BY END USER, 2026-2031 (USD MILLION)
- TABLE 87 EUROPE: SMART GAS METER MARKET, BY COUNTRY, 2022-2025 (USD MILLION)
- TABLE 88 EUROPE: SMART GAS METER MARKET, BY COUNTRY, 2026-2031 (USD MILLION)
- TABLE 89 GERMANY: SMART GAS METER MARKET, BY TECHNOLOGY, 2022-2025 (USD MILLION)
- TABLE 90 GERMANY: SMART GAS METER MARKET, BY TECHNOLOGY, 2026-2031 (USD MILLION)
- TABLE 91 GERMANY: SMART GAS METER MARKET, BY END USER, 2022-2025 (USD MILLION)
- TABLE 92 GERMANY: SMART GAS METER MARKET, BY END USER, 2026-2031 (USD MILLION)
- TABLE 93 FRANCE: SMART GAS METER MARKET, BY TECHNOLOGY, 2022-2025 (USD MILLION)
- TABLE 94 FRANCE: SMART GAS METER MARKET, BY TECHNOLOGY, 2026-2031 (USD MILLION)
- TABLE 95 FRANCE: SMART GAS METER MARKET, BY END USER, 2022-2025 (USD MILLION)
- TABLE 96 FRANCE: SMART GAS METER MARKET, BY END USER, 2026-2031 (USD MILLION)
- TABLE 97 UK: SMART GAS METER MARKET, BY TECHNOLOGY, 2022-2025 (USD MILLION)
- TABLE 98 UK: SMART GAS METER MARKET, BY TECHNOLOGY, 2026-2031 (USD MILLION)
- TABLE 99 UK: SMART GAS METER MARKET, BY END USER, 2022-2025 (USD MILLION)
- TABLE 100 UK: SMART GAS METER MARKET, BY END USER, 2026-2031 (USD MILLION)
- TABLE 101 SPAIN: SMART GAS METER MARKET, BY TECHNOLOGY, 2022-2025 (USD MILLION)
- TABLE 102 SPAIN: SMART GAS METER MARKET, BY TECHNOLOGY, 2026-2031 (USD MILLION)
- TABLE 103 SPAIN: SMART GAS METER MARKET, BY END USER, 2022-2025 (USD MILLION)
- TABLE 104 SPAIN: SMART GAS METER MARKET, BY END USER, 2026-2031 (USD MILLION)
- TABLE 105 ITALY: SMART GAS METER MARKET, BY TECHNOLOGY, 2022-2025 (USD MILLION)
- TABLE 106 ITALY: SMART GAS METER MARKET, BY TECHNOLOGY, 2026-2031 (USD MILLION)
- TABLE 107 ITALY: SMART GAS METER MARKET, BY END USER, 2022-2025 (USD MILLION)
- TABLE 108 ITALY: SMART GAS METER MARKET, BY END USER, 2026-2031 (USD MILLION)
- TABLE 109 POLAND: SMART GAS METER MARKET, BY TECHNOLOGY, 2022-2025 (USD MILLION)
- TABLE 110 POLAND: SMART GAS METER MARKET, BY TECHNOLOGY, 2026-2031 (USD MILLION)
- TABLE 111 POLAND: SMART GAS METER MARKET, BY END USER, 2022-2025 (USD MILLION)
- TABLE 112 POLAND: SMART GAS METER MARKET, BY END USER, 2026-2031 (USD MILLION)
- TABLE 113 REST OF EUROPE: SMART GAS METER MARKET, BY TECHNOLOGY, 2022-2025 (USD MILLION)
- TABLE 114 REST OF EUROPE: SMART GAS METER MARKET, BY TECHNOLOGY, 2026-2031 (USD MILLION)
- TABLE 115 REST OF EUROPE: SMART GAS METER MARKET, BY END USER, 2022-2025 (USD MILLION)
- TABLE 116 REST OF EUROPE: SMART GAS METER MARKET, BY END USER, 2026-2031 (USD MILLION)
- TABLE 117 ASIA PACIFIC: SMART GAS METER MARKET, BY TECHNOLOGY TYPE, 2022-2025 (USD MILLION)
- TABLE 118 ASIA PACIFIC: SMART GAS METER MARKET, BY TECHNOLOGY TYPE, 2026-2031 (USD MILLION)
- TABLE 119 ASIA PACIFIC: SMART GAS METER MARKET, BY TYPE, 2022-2025 (USD MILLION)
- TABLE 120 ASIA PACIFIC: SMART GAS METER MARKET, BY TYPE, 2026-2031 (USD MILLION)
- TABLE 121 ASIA PACIFIC: SMART GAS METER MARKET, BY COMPONENT, 2022-2025 (USD MILLION)
- TABLE 122 ASIA PACIFIC: SMART GAS METER MARKET, BY COMPONENT, 2026-2031 (USD MILLION)
- TABLE 123 ASIA PACIFIC: SMART GAS METER MARKET, BY END USER, 2022-2025 (USD MILLION)
- TABLE 124 ASIA PACIFIC: SMART GAS METER MARKET, BY END USER, 2026-2031 (USD MILLION)
- TABLE 125 ASIA PACIFIC: SMART GAS METER MARKET, BY COUNTRY, 2022-2025 (USD MILLION)
- TABLE 126 ASIA PACIFIC: SMART METER MARKET, BY COUNTRY, 2026-2031 (USD MILLION)
- TABLE 127 CHINA: SMART GAS METER MARKET, BY TECHNOLOGY, 2022-2025 (USD MILLION)
- TABLE 128 CHINA: SMART GAS METER MARKET, BY TECHNOLOGY, 2026-2031 (USD MILLION)
- TABLE 129 CHINA: SMART GAS METER MARKET, BY END USER, 2022-2025 (USD MILLION)
- TABLE 130 CHINA: SMART GAS METER MARKET, BY END USER, 2026-2031 (USD MILLION)
- TABLE 131 AUSTRALIA: SMART GAS METER MARKET, BY TECHNOLOGY, 2022-2025 (USD MILLION)
- TABLE 132 AUSTRALIA: SMART GAS METER MARKET, BY TECHNOLOGY, 2026-2031 (USD MILLION)
- TABLE 133 AUSTRALIA: SMART GAS METER MARKET, BY END USER, 2022-2025 (USD MILLION)
- TABLE 134 AUSTRALIA: SMART GAS METER MARKET, BY END USER, 2026-2031 (USD MILLION)
- TABLE 135 JAPAN: SMART GAS METER MARKET, BY TECHNOLOGY, 2022-2025 (USD MILLION)
- TABLE 136 JAPAN: SMART GAS METER MARKET, BY TECHNOLOGY, 2026-2031 (USD MILLION)
- TABLE 137 JAPAN: SMART GAS METER MARKET, BY END USER, 2022-2025 (USD MILLION)
- TABLE 138 JAPAN: SMART GAS METER MARKET, BY END USER, 2026-2031 (USD MILLION)
- TABLE 139 INDIA: SMART GAS METER MARKET, BY TECHNOLOGY, 2022-2025 (USD MILLION)
- TABLE 140 INDIA: SMART GAS METER MARKET, BY TECHNOLOGY, 2026-2031 (USD MILLION)
- TABLE 141 INDIA: SMART GAS METER MARKET, BY END USER, 2022-2025 (USD MILLION)
- TABLE 142 INDIA: SMART GAS METER MARKET, BY END USER, 2026-2031 (USD MILLION)
- TABLE 143 SOUTH KOREA: SMART GAS METER MARKET, BY TECHNOLOGY, 2022-2025 (USD MILLION)
- TABLE 144 SOUTH KOREA: SMART GAS METER MARKET, BY TECHNOLOGY, 2026-2031 (USD MILLION)
- TABLE 145 SOUTH KOREA: SMART GAS METER MARKET, BY END USER, 2022-2025 (USD MILLION)
- TABLE 146 SOUTH KOREA: SMART GAS METER MARKET, BY END USER, 2026-2031 (USD MILLION)
- TABLE 147 REST OF ASIA PACIFIC: SMART GAS METER MARKET, BY TECHNOLOGY, 2022-2025 (USD MILLION)
- TABLE 148 REST OF ASIA PACIFIC: SMART GAS METER MARKET, BY TECHNOLOGY, 2026-2031 (USD MILLION)
- TABLE 149 REST OF ASIA PACIFIC: SMART GAS METER MARKET, BY END USER, 2022-2025 (USD MILLION)
- TABLE 150 REST OF ASIA PACIFIC: SMART GAS METER MARKET, BY END USER, 2026-2031 (USD MILLION)
- TABLE 151 MIDDLE EAST & AFRICA: SMART GAS METER MARKET, BY TECHNOLOGY, 2022-2025 (USD MILLION)
- TABLE 152 MIDDLE EAST & AFRICA: SMART GAS METER MARKET, BY TECHNOLOGY, 2026-2031 (USD MILLION)
- TABLE 153 MIDDLE EAST & AFRICA: SMART GAS METER MARKET, BY TYPE, 2022-2025 (USD MILLION)
- TABLE 154 MIDDLE EAST & AFRICA: SMART GAS METER MARKET, BY TYPE, 2026-2031 (USD MILLION)
- TABLE 155 MIDDLE EAST & AFRICA: SMART GAS METER MARKET, BY COMPONENT, 2022-2025 (USD MILLION)
- TABLE 156 MIDDLE EAST & AFRICA: SMART GAS METER MARKET, BY COMPONENT, 2026-2031 (USD MILLION)
- TABLE 157 MIDDLE EAST & AFRICA: SMART GAS METER MARKET, BY END USER, 2022-2025 (USD MILLION)
- TABLE 158 MIDDLE EAST & AFRICA: SMART GAS METER MARKET, BY END USER, 2026-2031 (USD MILLION)
- TABLE 159 MIDDLE EAST & AFRICA: SMART GAS METER MARKET, BY COUNTRY, 2022-2025 (USD MILLION)
- TABLE 160 MIDDLE EAST & AFRICA: SMART GAS METER MARKET, BY COUNTRY, 2026-2031 (USD MILLION)
- TABLE 161 GCC: SMART METER MARKET, BY COUNTRY, 2022-2025 (USD MILLION)
- TABLE 162 GCC: SMART METER MARKET, BY COUNTRY, 2026-2031 (USD MILLION)
- TABLE 163 SAUDI ARABIA: SMART GAS METER MARKET, BY TECHNOLOGY, 2022-2025 (USD MILLION)
- TABLE 164 SAUDI ARABIA: SMART GAS METER MARKET, BY TECHNOLOGY, 2026-2031 (USD MILLION)
- TABLE 165 SAUDI ARABIA: SMART GAS METER MARKET, BY END USER, 2022-2025 (USD MILLION)
- TABLE 166 SAUDI ARABIA: SMART GAS METER MARKET, BY END USER, 2026-2031 (USD MILLION)
- TABLE 167 UAE: SMART GAS METER MARKET, BY TECHNOLOGY, 2022-2025 (USD MILLION)
- TABLE 168 UAE: SMART GAS METER MARKET, BY TECHNOLOGY, 2026-2031 (USD MILLION)
- TABLE 169 UAE: SMART GAS METER MARKET, BY END USER, 2022-2025 (USD MILLION)
- TABLE 170 UAE: SMART GAS METER MARKET, BY END USER, 2026-2031 (USD MILLION)
- TABLE 171 ISRAEL: SMART GAS METER MARKET, BY TECHNOLOGY, 2022-2025 (USD MILLION)
- TABLE 172 ISRAEL: SMART GAS METER MARKET, BY TECHNOLOGY, 2026-2031 (USD MILLION)
- TABLE 173 ISRAEL: SMART GAS METER MARKET, BY END USER, 2022-2025 (USD MILLION)
- TABLE 174 ISRAEL: SMART GAS METER MARKET, BY END USER, 2026-2031 (USD MILLION)
- TABLE 175 SOUTH AFRICA: SMART GAS METER MARKET, BY TECHNOLOGY, 2022-2025 (USD MILLION)
- TABLE 176 SOUTH AFRICA: SMART GAS METER MARKET, BY TECHNOLOGY, 2026-2031 (USD MILLION)
- TABLE 177 SOUTH AFRICA: SMART GAS METER MARKET, BY END USER, 2022-2025 (USD MILLION)
- TABLE 178 SOUTH AFRICA: SMART GAS METER MARKET, BY END USER, 2026-2031 (USD MILLION)
- TABLE 179 TURKEY: SMART GAS METER MARKET, BY TECHNOLOGY, 2022-2025 (USD MILLION)
- TABLE 180 TURKEY: SMART GAS METER MARKET, BY TECHNOLOGY, 2026-2031 (USD MILLION)
- TABLE 181 TURKEY: SMART GAS METER MARKET, BY END USER, 2022-2025 (USD MILLION)
- TABLE 182 TURKEY: SMART GAS METER MARKET, BY END USER, 2026-2031 (USD MILLION)
- TABLE 183 REST OF MIDDLE EAST & AFRICA: SMART GAS METER MARKET, BY TECHNOLOGY, 2022-2025 (USD MILLION)
- TABLE 184 REST OF MIDDLE EAST & AFRICA: SMART GAS METER MARKET, BY TECHNOLOGY, 2026-2031 (USD MILLION)
- TABLE 185 REST OF MIDDLE EAST & AFRICA: SMART GAS METER MARKET, BY END USER, 2022-2025 (USD MILLION)
- TABLE 186 REST OF MIDDLE EAST & AFRICA: SMART GAS METER MARKET, BY END USER, 2026-2031 (USD MILLION)
- TABLE 187 SOUTH AMERICA: SMART GAS METER MARKET, BY TECHNOLOGY, 2022-2025 (USD MILLION)
- TABLE 188 SOUTH AMERICA: SMART GAS METER MARKET, BY TECHNOLOGY, 2026-2031 (USD MILLION)
- TABLE 189 SOUTH AMERICA: SMART GAS METER MARKET, BY TYPE, 2022-2025 (USD MILLION)
- TABLE 190 SOUTH AMERICA: SMART GAS METER MARKET, BY TYPE, 2026-2031 (USD MILLION)
- TABLE 191 SOUTH AMERICA: SMART GAS METER MARKET, BY COMPONENT, 2022-2025 (USD MILLION)
- TABLE 192 SOUTH AMERICA: SMART GAS METER MARKET, BY COMPONENT, 2026-2031 (USD MILLION)
- TABLE 193 SOUTH AMERICA: SMART GAS METER MARKET, BY END USER, 2022-2025 (USD MILLION)
- TABLE 194 SOUTH AMERICA: SMART GAS METER MARKET, BY END USER, 2026-2031 (USD MILLION)
- TABLE 195 SOUTH AMERICA: SMART GAS METER MARKET, BY COUNTRY, 2022-2025 (USD MILLION)
- TABLE 196 SOUTH AMERICA: SMART GAS METER MARKET, BY COUNTRY, 2026-2031 (USD MILLION)
- TABLE 197 BRAZIL: SMART GAS METER MARKET, BY TECHNOLOGY, 2022-2025 (USD MILLION)
- TABLE 198 BRAZIL: SMART GAS METER MARKET, BY TECHNOLOGY, 2026-2031 (USD MILLION)
- TABLE 199 BRAZIL: SMART GAS METER MARKET, BY END USER, 2022-2025 (USD MILLION)
- TABLE 200 BRAZIL: SMART GAS METER MARKET, BY END USER, 2026-2031 (USD MILLION)
- TABLE 201 ARGENTINA: SMART GAS METER MARKET, BY TECHNOLOGY, 2022-2025 (USD MILLION)
- TABLE 202 ARGENTINA: SMART GAS METER MARKET, BY TECHNOLOGY, 2026-2031 (USD MILLION)
- TABLE 203 ARGENTINA: SMART GAS METER MARKET, BY END USER, 2022-2025 (USD MILLION)
- TABLE 204 ARGENTINA: SMART GAS METER MARKET, BY END USER, 2026-2031 (USD MILLION)
- TABLE 205 CHILE: SMART GAS METER MARKET, BY TECHNOLOGY, 2022-2025 (USD MILLION)
- TABLE 206 CHILE: SMART GAS METER MARKET, BY TECHNOLOGY, 2026-2031 (USD MILLION)
- TABLE 207 CHILE: SMART GAS METER MARKET, BY END USER, 2022-2025 (USD MILLION)
- TABLE 208 CHILE: SMART GAS METER MARKET, BY END USER, 2026-2031 (USD MILLION)
- TABLE 209 REST OF SOUTH AMERICA: SMART GAS METER MARKET, BY TECHNOLOGY, 2022-2025 (USD MILLION)
- TABLE 210 REST OF SOUTH AMERICA: SMART GAS METER MARKET, BY TECHNOLOGY, 2026-2031 (USD MILLION)
- TABLE 211 REST OF SOUTH AMERICA: SMART GAS METER MARKET, BY END USER, 2022-2025 (USD MILLION)
- TABLE 212 REST OF SOUTH AMERICA: SMART GAS METER MARKET, BY END USER, 2026-2031 (USD MILLION)
- TABLE 213 SMART GAS METER MARKET: OVERVIEW OF STRATEGIES ADOPTED BY KEY PLAYERS, JANUARY 2023-AUGUST 2026
- TABLE 214 SMART GAS METER MARKET: DEGREE OF COMPETITION, 2025
- TABLE 215 SMART GAS METER MARKET: REGION FOOTPRINT
- TABLE 216 SMART GAS METER MARKET: TECHNOLOGY FOOTPRINT
- TABLE 217 SMART GAS METER MARKET: TYPE FOOTPRINT
- TABLE 218 SMART GAS METER MARKET: END USER FOOTPRINT
- TABLE 219 SMART GAS METER MARKET: DETAILED LIST OF KEY STARTUPS/SMES
- TABLE 220 SMART GAS METER MARKET: COMPETITIVE BENCHMARKING OF KEY STARTUPS/SMES
- TABLE 221 SMART GAS METER MARKET: PRODUCT LAUNCHES, JANUARY 2023-AUGUST 2026
- TABLE 222 SMART GAS METER MARKET: DEALS, JANUARY 2023-AUGUST 2026
- TABLE 223 SMART GAS METER MARKET: EXPANSIONS, JANUARY 2023-AUGUST 2026
- TABLE 224 SMART GAS METER MARKET: OTHER DEVELOPMENTS, JANUARY 2023-AUGUST 2026
- TABLE 225 APATOR S.A.: COMPANY OVERVIEW
- TABLE 226 APATOR S.A.: PRODUCTS/SOLUTIONS/SERVICES OFFERED
- TABLE 227 APATOR S.A.: DEALS
- TABLE 228 APATOR S.A.: EXPANSIONS
- TABLE 229 APATOR S.A.: OTHER DEVELOPMENTS
- TABLE 230 DIEHL STIFTUNG & CO. KG: COMPANY OVERVIEW
- TABLE 231 DIEHL STIFTUNG & CO. KG: PRODUCTS/SOLUTIONS/SERVICES OFFERED
- TABLE 232 DIEHL STIFTUNG & CO. KG: PRODUCT LAUNCHES
- TABLE 233 DIEHL STIFTUNG & CO. KG: DEALS
- TABLE 234 DIEHL STIFTUNG & CO. KG: EXPANSIONS
- TABLE 235 HONEYWELL INTERNATIONAL INC.: COMPANY OVERVIEW
- TABLE 236 HONEYWELL INTERNATIONAL INC.: PRODUCTS/SOLUTIONS/SERVICES OFFERED
- TABLE 237 HONEYWELL INTERNATIONAL INC.: PRODUCT LAUNCHES
- TABLE 238 HONEYWELL INTERNATIONAL INC.: DEALS
- TABLE 239 ITRON INC.: COMPANY OVERVIEW
- TABLE 240 ITRON INC.: PRODUCTS/SOLUTIONS/SERVICES OFFERED
- TABLE 241 ITRON INC.: PRODUCT LAUNCHES
- TABLE 242 ITRON INC.: DEALS
- TABLE 243 ITRON, INC: EXPANSIONS
- TABLE 244 ITRON INC.: OTHER DEVELOPMENTS
- TABLE 245 LANDIS+GYR: COMPANY OVERVIEW
- TABLE 246 LANDIS+GYR: PRODUCTS/SOLUTIONS/SERVICES OFFERED
- TABLE 247 LANDIS+GYR: PRODUCT LAUNCHES
- TABLE 248 LANDIS+GYR: DEALS
- TABLE 249 LANDIS+GYR: OTHER DEVELOPMENTS
- TABLE 250 SENSUS(XYLEM): COMPANY OVERVIEW
- TABLE 251 SENSUS (XYLEM): PRODUCTS/SOLUTIONS/SERVICES OFFERED
- TABLE 252 SENSUS (XYLEM): PRODUCT LAUNCHES
- TABLE 253 SENSUS (XYLEM): DEALS
- TABLE 254 SENSUS (XYLEM): EXPANSIONS
- TABLE 255 EDMI LIMITED: COMPANY OVERVIEW
- TABLE 256 EDMI LIMITED: PRODUCTS/SOLUTIONS/SERVICES OFFERED
- TABLE 257 EDMI LIMITED: DEALS
- TABLE 258 CHONGQING SHANCHENG GAS EQUIPMENT CO., LTD.: COMPANY OVERVIEW
- TABLE 259 CHONGQING SHANCHENG GAS EQUIPMENT CO., LTD.: PRODUCTS/SOLUTIONS/SERVICES OFFERED
- TABLE 260 DONGFA (GROUP): COMPANY OVERVIEW
- TABLE 261 DONGFA (GROUP): PRODUCTS/SOLUTIONS/SERVICES OFFERED
- TABLE 262 RAYCHEM RPG PRIVATE LIMITED: COMPANY OVERVIEW
- TABLE 263 RAYCHEM RPG PRIVATE LIMITED: PRODUCTS/SOLUTIONS/SERVICES OFFERED
- TABLE 264 CHINT GROUP: COMPANY OVERVIEW
- TABLE 265 CHINT GROUP: PRODUCTS/SOLUTIONS/SERVICES OFFERED
- TABLE 266 CHINT GROUP: PRODUCT LAUNCHES
- TABLE 267 CHINT GROUP: DEALS
- TABLE 268 CHINT GROUP: OTHER DEVELOPMENTS
- TABLE 269 ZENNER INTERNATIONAL GMBH & CO. KG: COMPANY OVERVIEW
- TABLE 270 ZENNER INTERNATIONAL GMBH & CO. KG: PRODUCTS/SOLUTIONS/ SERVICES OFFERED
- TABLE 271 ZENNER INTERNATIONAL GMBH & CO. KG: PRODUCT LAUNCHES
- TABLE 272 ZENNER INTERNATIONAL GMBH & CO. KG: DEALS
- TABLE 273 MASTER METER INC.: COMPANY OVERVIEW
- TABLE 274 MASTER METER INC.: PRODUCTS/SOLUTIONS/SERVICES OFFERED
- TABLE 275 ACLARA TECHNOLOGIES: COMPANY OVERVIEW
- TABLE 276 ACLARA TECHNOLOGIES: PRODUCTS/SOLUTIONS/SERVICES OFFERED
- TABLE 277 WASION HOLDINGS INTERNATIONAL: COMPANY OVERVIEW
- TABLE 278 WASION HOLDINGS INTERNATIONAL: PRODUCTS/SOLUTIONS/SERVICES OFFERED
- TABLE 279 WASION HOLDINGS INTERNATIONAL: PRODUCT LAUNCHES
- TABLE 280 WASION HOLDINGS INTERNATIONAL: DEALS
- TABLE 281 WASION HOLDINGS INTERNATIONAL: EXPANSIONS
- TABLE 282 DATA CAPTURED FROM PRIMARY SOURCES
List of Figures
- FIGURE 1 SMART GAS METER MARKET SEGMENTATION AND REGIONAL SCOPE
- FIGURE 2 SMART GAS METER MARKET SCENARIO
- FIGURE 3 GLOBAL SMART GAS METER MARKET SIZE, 2022-2031
- FIGURE 4 MAJOR STRATEGIES ADOPTED BY KEY PLAYERS IN SMART GAS METER MARKET, 2023-2026
- FIGURE 5 DISRUPTIONS INFLUENCING GROWTH OF SMART GAS METER MARKET
- FIGURE 6 HIGH-GROWTH SEGMENTS IN SMART GAS METER MARKET, 2026-2031
- FIGURE 7 ASIA PACIFIC TO REGISTER HIGHEST CAGR DURING FORECAST PERIOD
- FIGURE 8 GOVERNMENT AMI MANDATES AND UTILITY MODERNIZATION PROGRAMS TO DRIVE MARKET
- FIGURE 9 AMI TECHNOLOGY AND ASIA PACIFIC REGION LED SMART GAS METER MARKET, BY TECHNOLOGY AND COUNTRY, IN 2025
- FIGURE 10 AMI TECHNOLOGY TO EXHIBIT HIGHER CAGR BETWEEN 2026 AND 2031
- FIGURE 11 SMART DIAPHRAGM GAS METER SEGMENT TO EXHIBIT HIGHER CAGR BETWEEN 2026 AND 2031
- FIGURE 12 HARDWARE SEGMENT TO LEAD SMART GAS METER MARKET IN 2031
- FIGURE 13 RESIDENTIAL SEGMENT TO DOMINATE SMART GAS METER OVER FORECAST PERIOD
- FIGURE 14 CHINA TO REGISTER HIGHEST CAGR IN GLOBAL SMART GAS METER MARKET DURING FORECAST PERIOD
- FIGURE 15 SMART GAS METER MARKET: DRIVERS, RESTRAINTS, OPPORTUNITIES, AND CHALLENGES
- FIGURE 16 US GRID MODERNIZATION INVESTMENT, 2026
- FIGURE 17 SMART METER INSTALLATIONS AND REPLACEMENTS IN GREAT BRITAIN, Q2 2026
- FIGURE 18 PORTER'S FIVE FORCES ANALYSIS
- FIGURE 19 SMART GAS METER VALUE CHAIN ANALYSIS
- FIGURE 20 SMART GAS METER ECOSYSTEM
- FIGURE 21 REGION-WISE AVERAGE SELLING PRICE TREND OF SMART GAS METER, 2023-2025
- FIGURE 22 IMPORT SCENARIO FOR HS CODE 902810-COMPLIANT PRODUCTS IN TOP 5 COUNTRIES, 2021-2025
- FIGURE 23 EXPORT SCENARIO FOR HS CODE 902810-COMPLIANT PRODUCTS IN TOP 5 COUNTRIES, 2021-2025
- FIGURE 24 TRENDS/DISRUPTIONS INFLUENCING CUSTOMER BUSINESS
- FIGURE 25 INVESTMENT AND FUNDING SCENARIO, 2025
- FIGURE 26 DECISION-MAKING FACTORS
- FIGURE 27 INFLUENCE OF STAKEHOLDERS ON BUYING PROCESS, BY END USER
- FIGURE 28 KEY BUYING CRITERIA, BY END USER
- FIGURE 29 PATENTS APPLIED AND GRANTED, 2016-2025
- FIGURE 30 FUTURE APPLICATIONS OF SMART GAS METERS
- FIGURE 31 SMART GAS METER MARKET, BY TECHNOLOGY, 2025
- FIGURE 32 SMART GAS METER MARKET, BY TYPE, 2025
- FIGURE 33 SMART GAS METER MARKET, BY COMPONENT, 2025
- FIGURE 34 SMART GAS METER MARKET, BY END USER, 2025
- FIGURE 35 ASIA PACIFIC TO REGISTER HIGHEST CAGR IN SMART GAS METER MARKET, IN TERMS OF VALUE, DURING FORECAST PERIOD
- FIGURE 36 SMART GAS METER MARKET SHARE, BY REGION, 2025
- FIGURE 37 NORTH AMERICA: SMART GAS METER MARKET SNAPSHOT
- FIGURE 38 SMART GAS METER MARKET SHARE ANALYSIS, 2025
- FIGURE 39 SMART GAS METER MARKET: SEGMENTAL REVENUE ANALYSIS OF TOP PLAYERS, 2021-2025
- FIGURE 40 BRAND/PRODUCT COMPARISON
- FIGURE 41 COMPANY VALUATION
- FIGURE 42 FINANCIAL METRICS
- FIGURE 43 COMPANY EVALUATION MATRIX (KEY PLAYERS), 2025
- FIGURE 45 SMART GAS METER MARKET: COMPETITIVE EVALUATION MATRIX (STARTUPS/SMES), 2025
- FIGURE 46 APATOR S.A.: COMPANY SNAPSHOT
- FIGURE 47 DIEHL STIFTUNG & CO. KG: COMPANY SNAPSHOT
- FIGURE 48 HONEYWELL INTERNATIONAL INC.: COMPANY SNAPSHOT
- FIGURE 49 ITRON INC.: COMPANY SNAPSHOT
- FIGURE 50 LANDIS+GYR: COMPANY SNAPSHOT
- FIGURE 51 SENSUS (XYLEM): COMPANY SNAPSHOT
- FIGURE 52 WASION HOLDINGS INTERNATIONAL: COMPANY SNAPSHOT
- FIGURE 53 SMART GAS METER MARKET: RESEARCH DESIGN
- FIGURE 54 DATA CAPTURED FROM SECONDARY SOURCES
- FIGURE 55 CORE FINDINGS FROM INDUSTRY EXPERTS
- FIGURE 56 BREAKDOWN OF PRIMARY INTERVIEWS: BY COMPANY TYPE, DESIGNATION, AND REGION
- FIGURE 57 SMART GAS METER MARKET: REGION-/COUNTRY-WISE ANALYSIS
- FIGURE 58 SMART GAS METER MARKET: TOP-DOWN APPROACH
- FIGURE 59 MAIN METRICS CONSIDERED WHILE CONSTRUCTING AND ASSESSING DEMAND FOR SMART GAS METERS
- FIGURE 60 KEY METRICS CONSIDERED FOR ASSESSING SUPPLY OF SMART GAS METERS
- FIGURE 61 SMART GAS METER MARKET: SUPPLY-SIDE ANALYSIS
- FIGURE 62 MARKET SHARE ANALYSIS OF SMART GAS METER PROVIDERS, 2025
- FIGURE 63 DATA TRIANGULATION

