
Need help finding what you are looking for?
Contact Us
PUBLISHER: Mordor Intelligence | PRODUCT CODE: 1430978

PUBLISHER: Mordor Intelligence | PRODUCT CODE: 1430978
Global Lubricants - Market Share Analysis, Industry Trends & Statistics, Growth Forecasts (2021 - 2026)
PUBLISHED:
PAGES: 80 Pages
DELIVERY TIME: 2-3 business days
SELECT AN OPTION
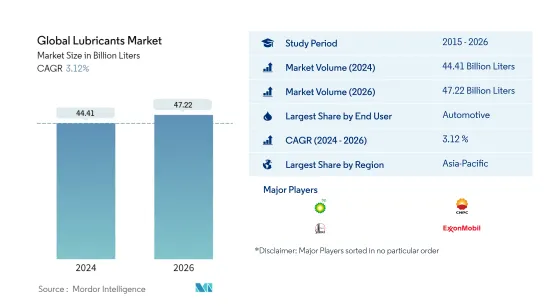
The Global Lubricants Market size is estimated at 44.41 Billion Liters in 2024, and is expected to reach 47.22 Billion Liters by 2026, growing at a CAGR of 3.12% during the forecast period (2024-2026).
Key Highlights
- Largest Segment by End-user Industry - Automotive : Automotive was the largest end-user among all categories due to the high replacement cycles of lubricants used in motor vehicles compared to any other industrial application.
- Fastest Segment by End-user Industry - Power Generation : Power generation is projected to be the fastest-growing end-user globally due to the increasing demand for low-cost energy from natural gas and wind power plants.
- Largest Region Market - Asia-Pacific : Asia-Pacific, driven mainly by India, China, and Japan, is the major lubricant-consuming region due to high vehicle ownerships and industrial machinery than any other region.
- Fastest Growing Region Market - Asia-Pacific : Due to rising urbanization, increased electricity use, and rising vehicle ownership in China and India, Asia-Pacific is projected to be the fastest-growing region.
Lubricants Market Trends
Largest Segment By End User : Automotive
- In 2020, the automotive industry dominated the global lubricants market, accounting for around half of the total lubricant consumption. During 2015-2019, lubricant consumption in the automotive industry increased by 11% due to growth in vehicle sales and usage.
- In 2020, COVID-19-related restrictions led to declined maintenance requirements from several industries. The major impact was observed in the automotive industry, which recorded a dip of 10.1% during the year, followed by heavy equipment (7.66%).
- Power generation is likely to be the fastest-growing end-user industry of the global lubricants market during 2021-2026, with a CAGR of 4.8%, followed by automotive (3.8%). The capacity additions in the renewable energy sector worldwide will likely drive lubricant consumption in the power generation industry.
Largest Region : Asia-Pacific
- In 2020, Asia-Pacific was the leading consumer of lubricants in the world, accounting for around 46% of the global lubricant consumption. During 2015-2019, lubricant consumption in the Asia-Pacific region increased by around 20%, driven by China, India, and Indonesia.
- In 2020, the COVID-19 outbreak restrained the operations of several industries, thereby restraining lubricant consumption across the globe. North America was the most affected, with a 13.4% drop in its lubricant consumption, followed by Europe, with an 11.29% drop, during 2019-20.
- Asia-Pacific is likely to be the fastest-growing lubricants market in Africa during 2021-26, with a CAGR of around 4.3%. The recovering automotive sales and usage combined with growing industrial activities in the region are likely to drive the growth of the Asia-Pacific lubricants market in the near future.
Lubricants Industry Overview
The Global Lubricants Market is fragmented, with the top five companies occupying 38.45%. The major players in this market are BP PLC (Castrol), China National Petroleum Corporation, China Petroleum & Chemical Corporation, ExxonMobil Corporation and Royal Dutch Shell PLC (sorted alphabetically).
Additional Benefits:
- The market estimate (ME) sheet in Excel format
- 3 months of analyst support
Product Code: 90328
TABLE OF CONTENTS
1 Executive Summary & Key Findings
2 Introduction
- 2.1 Study Assumptions & Market Definition
- 2.2 Scope of the Study
- 2.3 Research Methodology
3 Key Industry Trends
- 3.1 Automotive Industry Trends
- 3.2 Manufacturing Industry Trends
- 3.3 Power Generation Industry Trends
- 3.4 Regulatory Framework
- 3.5 Value Chain & Distribution Channel Analysis
4 Market Segmentation
- 4.1 By End User
- 4.1.1 Automotive
- 4.1.2 Heavy Equipment
- 4.1.3 Metallurgy & Metalworking
- 4.1.4 Power Generation
- 4.1.5 Other End-user Industries
- 4.2 By Product Type
- 4.2.1 Engine Oils
- 4.2.2 Greases
- 4.2.3 Hydraulic Fluids
- 4.2.4 Metalworking Fluids
- 4.2.5 Transmission & Gear Oils
- 4.2.6 Other Product Types
- 4.3 By Region
- 4.3.1 Africa
- 4.3.1.1 Egypt
- 4.3.1.2 Morocco
- 4.3.1.3 Nigeria
- 4.3.1.4 South Africa
- 4.3.1.5 Rest of Africa
- 4.3.2 Asia-Pacific
- 4.3.2.1 China
- 4.3.2.2 India
- 4.3.2.3 Indonesia
- 4.3.2.4 Japan
- 4.3.2.5 Malaysia
- 4.3.2.6 South Korea
- 4.3.2.7 Thailand
- 4.3.2.8 Vietnam
- 4.3.2.9 Rest of Asia-Pacific
- 4.3.3 Europe
- 4.3.3.1 France
- 4.3.3.2 Germany
- 4.3.3.3 Italy
- 4.3.3.4 Russia
- 4.3.3.5 Spain
- 4.3.3.6 United Kingdom
- 4.3.3.7 Rest of Europe
- 4.3.4 Middle East
- 4.3.4.1 Iran
- 4.3.4.2 Qatar
- 4.3.4.3 Saudi Arabia
- 4.3.4.4 Turkey
- 4.3.4.5 UAE
- 4.3.4.6 Rest of Middle East
- 4.3.5 North America
- 4.3.5.1 Canada
- 4.3.5.2 Mexico
- 4.3.5.3 United States
- 4.3.5.4 Rest of North America
- 4.3.6 South America
- 4.3.6.1 Argentina
- 4.3.6.2 Brazil
- 4.3.6.3 Rest of South America
- 4.3.1 Africa
5 Competitive Landscape
- 5.1 Key Strategic Moves
- 5.2 Market Share Analysis
- 5.3 Company Profiles
- 5.3.1 Behran Oil Company
- 5.3.2 BP PLC (Castrol)
- 5.3.3 Carl Bechem GmbH
- 5.3.4 Chevron Corporation
- 5.3.5 China National Petroleum Corporation
- 5.3.6 China Petroleum & Chemical Corporation
- 5.3.7 Coperative Soceite des petroleum
- 5.3.8 ENEOS Corporation
- 5.3.9 Eni SpA
- 5.3.10 ExxonMobil Corporation
- 5.3.11 FUCHS
- 5.3.12 Gazprom
- 5.3.13 GS Caltex
- 5.3.14 Gulf Oil International
- 5.3.15 Hindustan Petroleum Corporation Limited
- 5.3.16 Idemitsu Kosan Co. Ltd
- 5.3.17 Indian Oil Corporation Limited
- 5.3.18 Lukoil
- 5.3.19 Motul
- 5.3.20 Petromin Corporation
- 5.3.21 Petronas Lubricants International
- 5.3.22 Phillips 66 Lubricants
- 5.3.23 PT Pertamina
- 5.3.24 PTT Lubricants
- 5.3.25 Rosneft
- 5.3.26 Royal Dutch Shell PLC
- 5.3.27 Terpel
- 5.3.28 TotalEnergies
- 5.3.29 Valvoline Inc.
- 5.3.30 YPF
6 Appendix
- 6.1 Appendix-1 References
- 6.2 Appendix-2 List of Tables & Figures
7 Key Strategic Questions for Lubricants CEOs
Have a question?


SELECT AN OPTION
Have a question?
Questions? Please give us a call or visit the contact form.