
PUBLISHER: Mordor Intelligence | PRODUCT CODE: 1911813

PUBLISHER: Mordor Intelligence | PRODUCT CODE: 1911813
East Africa Lubricants - Market Share Analysis, Industry Trends & Statistics, Growth Forecasts (2026 - 2031)
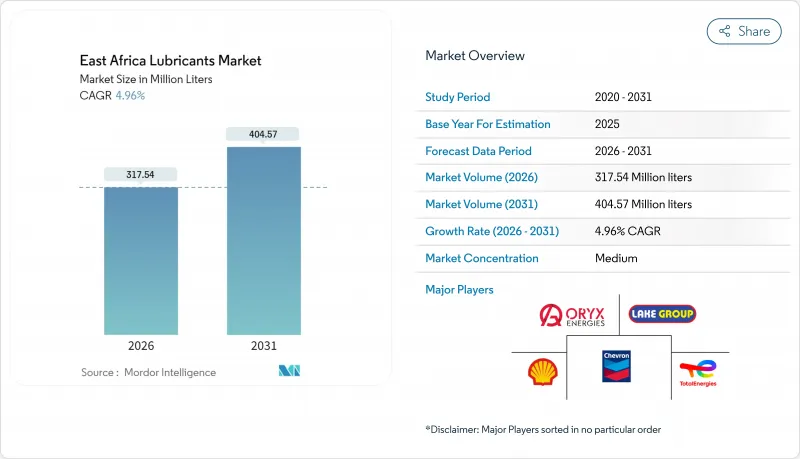
The East Africa Lubricants Market is expected to grow from 302.53 million liters in 2025 to 317.54 million liters in 2026 and is forecast to reach 404.57 million liters by 2031 at 4.96% CAGR over 2026-2031.
Current expansion is propelled by an infrastructure boom, resilient automotive demand, and the region's integration into the African Continental Free Trade Area, collectively transforming the East Africa lubricants market into a pivotal consumption hub. Cross-border trade harmonization removes tariff barriers that once constrained circulation, while OEM specifications for higher-grade synthetics steadily lift the value of every liter sold. A steady pipeline of megaprojects, from the Standard Gauge Railway in Kenya to gas liquefaction plants in Tanzania, funnels heavy-duty equipment requirements back into the East Africa lubricants market. At the same time, local blenders add capacity to cut freight costs, shorten lead times, and elevate quality oversight, reinforcing regional self-sufficiency amidst global supply risk.
East Africa Lubricants Market Trends and Insights
Industrial and Infrastructure Boom
Megaproject spending above USD 50 billion in Kenya and Uganda, plus USD 20 billion earmarked for Tanzanian gas facilities, translates into year-round consumption of specialized hydraulic fluids, gear oils, and heavy-duty engine lubricants. Hydropower builds such as Karuma and the widening of the Standard Gauge Railway intensify demand for metalworking fluids across fabrication shops. The IGAD master plan to convert transport corridors into economic corridors ensures that construction equipment fleets remain active, feeding direct volume growth into the East Africa lubricants market. Improved highways lower freight costs for distributors servicing remote sites, broadening last-mile reach. Each project also accelerates auxiliary industries such as cement, aggregates, and steel, multiplying lubricant touchpoints across the supply chain.
Rapid Growth of Used-Vehicle Fleet
Second-hand imports surge as consumers seek affordable mobility, forcing more frequent oil changes that lift per-vehicle lubricant consumption. Uganda's registration data mirrors a regional trend where aging trucks shuttle agricultural output across borders. Kenya's re-emerging assembly lines add industrial lubricant demand inside production plants while sustaining aftermarket sales outside factory gates. Motorcycles, now indispensable in rural logistics, popularize smaller pack sizes and two-stroke formulations. Cost-sensitive fleet managers realize that premium synthetics can lower total cost of ownership, nudging up-trading within the East Africa lubricants market. Digital ride-hailing platforms further formalize maintenance schedules, institutionalizing steady demand.
Base-Oil Price Volatility
Crude swings compress margins for blenders lacking hedging tools, stoking frequent price revisions at retail. Import bottlenecks intensify because only Sudan's Al-Jaili refinery runs partial capacity, leaving East Africa reliant on distant suppliers. Inflationary pass-through raises end-user operating costs, tempting some operators to stretch drain intervals, thereby weakening volume growth. Smaller distributors risk stockouts when letters of credit become costlier, nudging market share toward cash-rich multinationals. Volatility also delays capital decisions on new blending plants, prolonging supply insecurity.
Other drivers and restraints analyzed in the detailed report include:
- OEM Push Toward Higher-Grade Synthetics
- Cross-Border Trade Liberalization (AfCFTA)
- Foreign-Exchange Shortages
For complete list of drivers and restraints, kindly check the Table Of Contents.
Segment Analysis
Engine oils continued to account for 45.62% of the East Africa lubricants market in 2025, supported by a vast installed base of passenger and commercial vehicles. Transmission and gear oils are set to outpace all other categories at a 5.12% CAGR, mirroring growth in articulated trucks and construction machinery that demand specialty drivetrain fluids. The segment's rapid shift toward synthetics signals higher per-unit value even as volumes climb, anchoring profitability for major suppliers.
Across construction sites, hydraulic fluid usage rides on the back of sustained earth-moving activity, while metalworking fluids register upticks as Kenya's and Tanzania's industrial parks cut and shape steel for rail, port, and energy projects. Greases remain indispensable in mining conveyor bearings and marine deck gear despite their smaller absolute tonnage. Local blenders integrate anti-counterfeit QR codes to safeguard brand equity, a move welcomed by regulators aiming to sanitize the East Africa lubricants industry. Shell's portfolio dominance demonstrates how multinationals capitalize on broad SKU coverage and entrenched channel presence to reinforce competitive moats.
The East Africa Lubricants Report is Segmented by Product Type (Engine Oils, Transmission and Gear Oils, Hydraulic Fluids, Greases, and More), End-User Industry (Automotive, Heavy Equipment, Metallurgy and Metalworking, Power Generation, and More), and Geography (Kenya, Tanzania, Uganda, Ethiopia, Rwanda, Burundi, and Democratic Republic of Congo). The Market Forecasts are Provided in Terms of Volume (Million Liters).
List of Companies Covered in this Report:
- BP plc
- Chevron Corporation
- Engen Petroleum Ltd.
- ENOC
- ExxonMobil
- General Petroleum FZE
- Hass Petroleum
- Lake Group
- LIQUI MOLY GmbH
- MOCL (Mineral Oil Corporation Ltd.)
- Motul S.A.
- National Oil Corporation of Kenya, Energizing Kenya
- Oryx Energies
- Rubis Energie
- Shell plc
- SINOPEC
- TotalEnergies
- Vivo Energy Holding B.V.
- Yana Oil (Bureau Veritas)
Additional Benefits:
- The market estimate (ME) sheet in Excel format
- 3 months of analyst support
TABLE OF CONTENTS
1 Introduction
- 1.1 Study Assumptions and Market Definition
- 1.2 Scope of the Study
2 Research Methodology
3 Executive Summary
4 Market Landscape
- 4.1 Market Overview
- 4.2 Market Drivers
- 4.2.1 Industrial and Infrastructure Boom
- 4.2.2 Rapid Growth of Used-Vehicle Fleet
- 4.2.3 OEM Push toward Higher-Grade Synthetics
- 4.2.4 Cross-Border Trade Liberalization (AfCFTA)
- 4.2.5 Local Blending Capacity Expansion
- 4.3 Market Restraints
- 4.3.1 Base-Oil Price Volatility
- 4.3.2 Counterfeit and Sub-Standard Products
- 4.3.3 Foreign-Exchange Shortages
- 4.4 Value Chain Analysis
- 4.5 Porter's Five Forces
- 4.5.1 Bargaining Power of Suppliers
- 4.5.2 Bargaining Power of Buyers
- 4.5.3 Threat of New Entrants
- 4.5.4 Threat of Substitutes
- 4.5.5 Degree of Competition
5 Market Size and Growth Forecasts (Volume)
- 5.1 By Product Type
- 5.1.1 Engine Oils
- 5.1.2 Transmission and Gear Oils
- 5.1.3 Hydraulic Fluids
- 5.1.4 Greases
- 5.1.5 Metalworking Fluids
- 5.1.6 Other Product Types (Compressor Oils, Process Oils, etc.)
- 5.2 By End User Industry
- 5.2.1 Automotive
- 5.2.1.1 Passenger Vehicles
- 5.2.1.2 Commercial Vehicles
- 5.2.1.3 Motorcycles
- 5.2.2 Heavy Equipment
- 5.2.3 Metallurgy and Metalworking
- 5.2.4 Power Generation
- 5.2.5 Marine
- 5.2.6 Other End-user Industries (Oil and Gas, Agri, Cement, etc.)
- 5.2.1 Automotive
- 5.3 By Geography
- 5.3.1 Kenya
- 5.3.2 Tanzania
- 5.3.3 Uganda
- 5.3.4 Ethiopia
- 5.3.5 Rwanda
- 5.3.6 Burundi
- 5.3.7 Democratic Republic of Congo
6 Competitive Landscape
- 6.1 Market Concentration
- 6.2 Strategic Moves
- 6.3 Market Share (%)/Ranking Analysis
- 6.4 Company Profiles (includes Global level Overview, Market level overview, Core Segments, Financials as available, Strategic Information, Market Rank/Share for key companies, Products and Services, and Recent Developments)
- 6.4.1 BP plc
- 6.4.2 Chevron Corporation
- 6.4.3 Engen Petroleum Ltd.
- 6.4.4 ENOC
- 6.4.5 ExxonMobil
- 6.4.6 General Petroleum FZE
- 6.4.7 Hass Petroleum
- 6.4.8 Lake Group
- 6.4.9 LIQUI MOLY GmbH
- 6.4.10 MOCL (Mineral Oil Corporation Ltd.)
- 6.4.11 Motul S.A.
- 6.4.12 National Oil Corporation of Kenya, Energizing Kenya
- 6.4.13 Oryx Energies
- 6.4.14 Rubis Energie
- 6.4.15 Shell plc
- 6.4.16 SINOPEC
- 6.4.17 TotalEnergies
- 6.4.18 Vivo Energy Holding B.V.
- 6.4.19 Yana Oil (Bureau Veritas)
7 Market Opportunities and Future Outlook
- 7.1 White-space and Unmet-Need Assessment
- 7.2 Growth of waste-oil collection and re-refining
- 7.3 Emerging e-commerce channels for lubricants

