
Need help finding what you are looking for?
Contact Us
PUBLISHER: Mordor Intelligence | PRODUCT CODE: 1693734

PUBLISHER: Mordor Intelligence | PRODUCT CODE: 1693734
Africa Feed Enzymes - Market Share Analysis, Industry Trends & Statistics, Growth Forecasts (2025 - 2030)
PUBLISHED:
PAGES: 205 Pages
DELIVERY TIME: 2-3 business days
SELECT AN OPTION
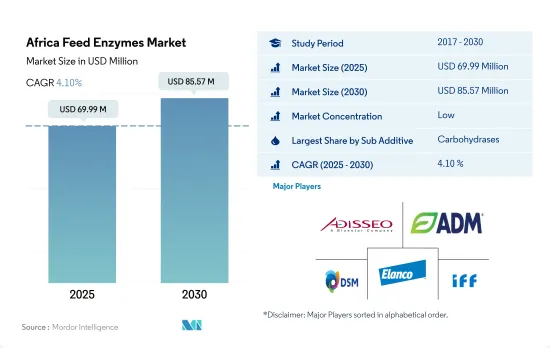
The Africa Feed Enzymes Market size is estimated at 69.99 million USD in 2025, and is expected to reach 85.57 million USD by 2030, growing at a CAGR of 4.10% during the forecast period (2025-2030).
- The African feed enzymes market showed slow growth in recent years, accounting for only 3.8% of the total feed additives market in 2022. However, South Africa emerged as a dominant player in the region, accounting for 47.4% of the market share due to its significant feed production of 11 million metric tons in 2022.
- Although the market witnessed a decline of 28% in 2019 due to reduced feed production as a result of Avian flu and ASF outbreaks, carbohydrases emerged as a significant feed enzyme in the market due to their ability to increase the intake of protein, minerals, and lipids from animal feed. The carbohydrases segment accounted for 50% of the feed enzymes market in 2022.
- Among animal types, poultry birds are the largest segment of the feed carbohydrases segment, accounting for 57.9% of the market share in 2022, as carbohydrases aid in the digestion of non-soluble polysaccharides.
- South Africa is the fastest-growing country in Africa, and it is expected to register a CAGR of 4.7% during the forecast period (2023-2029). However, both carbohydrases and phytases are growing at an equal rate in the region and are expected to record a CAGR of 4.1% each during the forecast period.
- Factors such as the increasing awareness of the usage of feed additives and the demand for meat and livestock are expected to drive the African feed enzymes market's growth. It is expected to record a CAGR of 4.1% during the forecast period as enzymatic action increases the amount of cereal absorbed in an animal body, particularly when cereal prices are high.
- The African feed enzymes market experienced moderate growth of 6.0% during 2017-2022, with a share by value of approximately 3.7% in the global feed additives market. However, the region faced a sudden dip in 2019 due to the collapsed GDP growth of major countries, such as South Africa, leading to reduced consumer spending power and decreased feed production.
- Despite the setback, South Africa remained the largest country-wise segment in the African feed enzymes market, accounting for around USD 29.5 million in 2022, followed by Egypt with USD 11.1 million. Poultry birds were the largest consumers of feed enzymes, accounting for a 55.7% share by value in 2022, while ruminants, swine, and aquaculture accounted for shares of 32.2%, 7.5%, and 3.5%, respectively. Due to the growing demand for pork, the swine feed enzymes market is expected to grow at the fastest rate, with a CAGR of 4.9% during the forecast period (2023-2029).
- In 2022, the African region produced approximately 131 million metric ton of compound feed for all animal types, with South Africa accounting for more than 29% of the share. In 2021, South Africa held more than an 8% share of the poultry bird segment in the African region.
- The rising demand for meat and increasing awareness of healthy animal diets are driving the growth of feed enzyme consumption in the region. As a result, the African region of the global feed enzyme market is projected to record a CAGR of 4.1% between 2023 and 2029, providing ample opportunities for key players to expand their business in the African feed enzymes market.
Africa Feed Enzymes Market Trends
The increasing per capita consumption of poultry meat and eggs with higher profit margins which is increasing the poultry production in Africa region
- The African poultry industry plays an important role in commercial activities and in providing quality protein to subsistence farmers and rural communities. Poultry birds accounted for 61.5% of the total animal headcount in Africa in 2022 due to the rising demand for poultry meat and eggs in the region. The number of poultry birds increased by 8.8% from 2017 to 2.2 billion heads in 2022, largely driven by the growth of poultry farms in the region.
- Among the poultry birds, broilers were highly raised due to the increasing demand for meat in the region. In South Africa, chicken meat production increased from 1,570 thousand metric tons in 2021 to 1,577 thousand metric tons in 2022 as major producers invested in the industry to capitalize on higher international and domestic poultry prices and profit margins.
- The African poultry industry is expanding due to the growing demand for poultry products from key importing countries, leading to increased investments in poultry farming. For example, in 2021, Quantum Foods, one of South Africa's largest poultry producers, invested over USD 14 million in its poultry operations, including constructing hatcheries and upgrading broiler farms to boost productivity.
- The per capita consumption of poultry meat in South Africa rose from 33.7 kg in 2017 to 35.09 kg in 2022. It is expected to register a CAGR of 7.5% during the forecast period (2023-2029) due to the increasing prices of other animal proteins like beef and lamb. These factors are projected to increase the number of farms and headcount during the forecast period.
Expansion of integrated fish farming and development of inland fisheries is increasing the demand for compound aqua feed
- Aquaculture farming has become one of the largest industries in the agriculture sector in many countries across Africa. Due to unfavorable climatic conditions and a reduction in fish catch, the usage of compound feed in the region decreased by 60% in 2019 compared to 2018. The increase in freshwater and marine aquaculture farming in the region caused a surge in demand for compound feed, which grew by 152% from 2019 to reach 1.5 million metric tons in 2022. Despite this increase, aquaculture feed production only accounted for 4.3% of African feed production in 2022.
- The recent rise in aquaculture production is credited to a significant expansion in the application of nutritional feed, such as the use of extruded feed, improved farm management practices, and an increase in investments, which led to a 1.3% growth in the production of compound feed from 2020 to 2022. For example, the Egyptian aquaculture feed industry underwent rapid development, with a shift from conventionally pelleted feeds at 10% to high-quality extruded feeds at 90%. The Fish Farming Development Fund and similar government schemes in other countries, such as Nigeria, are expected to drive aquaculture farming in the region, thereby increasing feed production.
- Egypt's fisheries and aquaculture development plan aims to increase fish production to 3 million metric tons by 2025 through the expansion of integrated fish farming, development of inland fisheries, and mega-national productions. Therefore, an increase in aquaculture production, a rise in the usage of high-quality extruded feed, and an increase in investments are expected to drive feed production in the region.
Africa Feed Enzymes Industry Overview
The Africa Feed Enzymes Market is fragmented, with the top five companies occupying 18.19%. The major players in this market are Adisseo, Archer Daniel Midland Co., DSM Nutritional Products AG, Elanco Animal Health Inc. and IFF(Danisco Animal Nutrition) (sorted alphabetically).
Additional Benefits:
- The market estimate (ME) sheet in Excel format
- 3 months of analyst support
Product Code: 93768
TABLE OF CONTENTS
1 EXECUTIVE SUMMARY & KEY FINDINGS
2 REPORT OFFERS
3 INTRODUCTION
- 3.1 Study Assumptions & Market Definition
- 3.2 Scope of the Study
- 3.3 Research Methodology
4 KEY INDUSTRY TRENDS
- 4.1 Animal Headcount
- 4.1.1 Poultry
- 4.1.2 Ruminants
- 4.1.3 Swine
- 4.2 Feed Production
- 4.2.1 Aquaculture
- 4.2.2 Poultry
- 4.2.3 Ruminants
- 4.2.4 Swine
- 4.3 Regulatory Framework
- 4.3.1 Egypt
- 4.3.2 Kenya
- 4.3.3 South Africa
- 4.4 Value Chain & Distribution Channel Analysis
5 MARKET SEGMENTATION (includes market size in Value in USD and Volume, Forecasts up to 2030 and analysis of growth prospects)
- 5.1 Sub Additive
- 5.1.1 Carbohydrases
- 5.1.2 Phytases
- 5.1.3 Other Enzymes
- 5.2 Animal
- 5.2.1 Aquaculture
- 5.2.1.1 By Sub Animal
- 5.2.1.1.1 Fish
- 5.2.1.1.2 Shrimp
- 5.2.1.1.3 Other Aquaculture Species
- 5.2.2 Poultry
- 5.2.2.1 By Sub Animal
- 5.2.2.1.1 Broiler
- 5.2.2.1.2 Layer
- 5.2.2.1.3 Other Poultry Birds
- 5.2.3 Ruminants
- 5.2.3.1 By Sub Animal
- 5.2.3.1.1 Beef Cattle
- 5.2.3.1.2 Dairy Cattle
- 5.2.3.1.3 Other Ruminants
- 5.2.4 Swine
- 5.2.5 Other Animals
- 5.2.1 Aquaculture
- 5.3 Country
- 5.3.1 Egypt
- 5.3.2 Kenya
- 5.3.3 South Africa
- 5.3.4 Rest of Africa
6 COMPETITIVE LANDSCAPE
- 6.1 Key Strategic Moves
- 6.2 Market Share Analysis
- 6.3 Company Landscape
- 6.4 Company Profiles (includes Global Level Overview, Market Level Overview, Core Business Segments, Financials, Headcount, Key Information, Market Rank, Market Share, Products and Services, and Analysis of Recent Developments).
- 6.4.1 Adisseo
- 6.4.2 Alltech, Inc.
- 6.4.3 Archer Daniel Midland Co.
- 6.4.4 BASF SE
- 6.4.5 Brenntag SE
- 6.4.6 Cargill Inc.
- 6.4.7 DSM Nutritional Products AG
- 6.4.8 Elanco Animal Health Inc.
- 6.4.9 IFF(Danisco Animal Nutrition)
- 6.4.10 Kemin Industries
7 KEY STRATEGIC QUESTIONS FOR FEED ADDITIVE CEOS
8 APPENDIX
- 8.1 Global Overview
- 8.1.1 Overview
- 8.1.2 Porter's Five Forces Framework
- 8.1.3 Global Value Chain Analysis
- 8.1.4 Global Market Size and DROs
- 8.2 Sources & References
- 8.3 List of Tables & Figures
- 8.4 Primary Insights
- 8.5 Data Pack
- 8.6 Glossary of Terms
Have a question?


SELECT AN OPTION
Have a question?
Questions? Please give us a call or visit the contact form.