
Need help finding what you are looking for?
Contact Us
PUBLISHER: Mordor Intelligence | PRODUCT CODE: 1693868

PUBLISHER: Mordor Intelligence | PRODUCT CODE: 1693868
United States Dairy Alternatives - Market Share Analysis, Industry Trends & Statistics, Growth Forecasts (2025 - 2030)
PUBLISHED:
PAGES: 200 Pages
DELIVERY TIME: 2-3 business days
SELECT AN OPTION
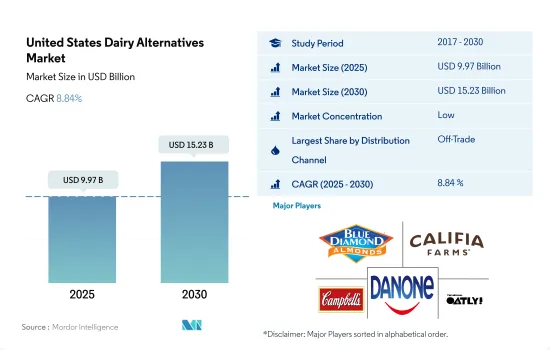
The United States Dairy Alternatives Market size is estimated at 9.97 billion USD in 2025, and is expected to reach 15.23 billion USD by 2030, growing at a CAGR of 8.84% during the forecast period (2025-2030).
Market is driven by sustainable growth in sales of plant-based milk led by off-trade retail channels
- Consumers purchased more plant-based dairy through retail groceries (off-trade) than ever in 2020, resulting in a 14% increase in sales. All categories of dairy alternatives showed growth, which was able to hold steady after recording significant growth in 2020. This demonstrates the incredible opportunities available for brands in every part of the store and across online platforms. In 2021, 42% of households purchased plant-based milk, and 76% of plant-based milk buyers made multiple purchases.
- The country currently has a nascent market for on-trade channels, as consumers prefer to consume dairy alternatives at home rather than at restaurants or food service outlets. Approximately 93% of meals or snacks that include milk alternatives are consumed at home, while only 7% are consumed at a restaurant or food service outlet. Within the food service industry, plant-based foods account for less than 1% of all foods shipped through broadline foodservice distribution to commercial and non-commercial food service outlets.
- Off-trade remains the primary outlet for sales of plant-based dairy across all product categories. For example, plant-based milk occupies 16% of all retail milk dollar sales in conventional channels and 40% in the Natural Enhanced Channel. The latter represents over 50 retailers and approximately 2,000 natural retail stores.
- The online channel is expected to be the fastest-growing distribution channel in the off-trade segment, with a projected Y-o-Y growth rate of 32% from 2023 to 2025. Convenience is the primary motivation for 61.1% of shoppers who have transitioned to shopping for groceries online. This growth can be attributed to the increasing number of smartphone users, which saw an increase of 11 million between 2020 and 2021.
United States Dairy Alternatives Market Trends
The surge in dairy alternatives consumption in North America: driven by growing animal welfare concerns and investments in plant-based food companies
- The consumption of dairy alternatives per person is experiencing significant growth in the United States, supported by investments and innovative products. This trend is leading to more than 52% of US consumers showing a preference for plant-based foods. One of the primary reasons behind this shift is the increasing number of people adopting a vegan lifestyle to support animal welfare, given that factory farming, which lacks humane treatment of animals, is prevalent in the United States. As of 2022, 7% of US consumers adhered to a flexitarian diet, compared to over 12% who prefer a plant-based diet. Although individuals of all age groups in the United States are interested in plant-based foods, those in their 20s and 30s exhibit the highest level of interest.
- Governmental support plays a significant role in boosting the production and consumption of plant-based dairy products in the country. Recognizing the importance and growth potential of the plant-based food industry, the US government has taken initiatives to promote it. In 2021, plant-based food companies in the United States received a total of USD 5 billion in funding, marking a 60% increase from 2020. The most mature segment of the alternative industry, the plant-based alternatives sector, secured USD 1.9 billion in investments in 2021. As of 2021, 62% or 79 million US households purchased plant-based products, representing an increase from 61% or 77 million households in 2020. The options available at grocery stores are becoming increasingly diverse, with a wide range of dairy alternatives such as yogurt, milk, ice cream, and cheese. In 2021, a significant portion of the population chose non-dairy versions of butter (23%), ice cream (26%), milk (26%), yogurt (22%), and yogurt-based smoothies or drinks (27%).
United States Dairy Alternatives Industry Overview
The United States Dairy Alternatives Market is fragmented, with the top five companies occupying 26.32%. The major players in this market are Blue Diamond Growers, Califia Farms LLC, Campbell Soup Company, Danone SA and Oatly Group AB (sorted alphabetically).
Additional Benefits:
- The market estimate (ME) sheet in Excel format
- 3 months of analyst support
Product Code: 50000727
TABLE OF CONTENTS
1 EXECUTIVE SUMMARY & KEY FINDINGS
2 REPORT OFFERS
3 INTRODUCTION
- 3.1 Study Assumptions & Market Definition
- 3.2 Scope of the Study
- 3.3 Research Methodology
4 KEY INDUSTRY TRENDS
- 4.1 Per Capita Consumption
- 4.2 Raw Material/commodity Production
- 4.2.1 Dairy Alternative - Raw Material Production
- 4.3 Regulatory Framework
- 4.3.1 United States
- 4.4 Value Chain & Distribution Channel Analysis
5 MARKET SEGMENTATION (includes market size in Value in USD and Volume, Forecasts up to 2030 and analysis of growth prospects)
- 5.1 Category
- 5.1.1 Non-Dairy Butter
- 5.1.2 Non-Dairy Cheese
- 5.1.3 Non-Dairy Ice Cream
- 5.1.4 Non-Dairy Milk
- 5.1.4.1 By Product Type
- 5.1.4.1.1 Almond Milk
- 5.1.4.1.2 Cashew Milk
- 5.1.4.1.3 Coconut Milk
- 5.1.4.1.4 Hemp Milk
- 5.1.4.1.5 Oat Milk
- 5.1.4.1.6 Soy Milk
- 5.1.5 Non-Dairy Yogurt
- 5.2 Distribution Channel
- 5.2.1 Off-Trade
- 5.2.1.1 Convenience Stores
- 5.2.1.2 Online Retail
- 5.2.1.3 Specialist Retailers
- 5.2.1.4 Supermarkets and Hypermarkets
- 5.2.1.5 Others (Warehouse clubs, gas stations, etc.)
- 5.2.2 On-Trade
- 5.2.1 Off-Trade
6 COMPETITIVE LANDSCAPE
- 6.1 Key Strategic Moves
- 6.2 Market Share Analysis
- 6.3 Company Landscape
- 6.4 Company Profiles (includes Global Level Overview, Market Level Overview, Core Business Segments, Financials, Headcount, Key Information, Market Rank, Market Share, Products and Services, and Analysis of Recent Developments).
- 6.4.1 Blue Diamond Growers
- 6.4.2 Califia Farms LLC
- 6.4.3 Campbell Soup Company
- 6.4.4 Danone SA
- 6.4.5 Miyoko's Creamery
- 6.4.6 Nuts for Cheese
- 6.4.7 Oatly Group AB
- 6.4.8 Ripple Foods PBC
- 6.4.9 SunOpta Inc.
- 6.4.10 The J.M. Smucker Company
- 6.4.11 Tofutti Brands Inc.
7 KEY STRATEGIC QUESTIONS FOR DAIRY AND DAIRY ALTERNATIVE CEOS
8 APPENDIX
- 8.1 Global Overview
- 8.1.1 Overview
- 8.1.2 Porter's Five Forces Framework
- 8.1.3 Global Value Chain Analysis
- 8.1.4 Market Dynamics (DROs)
- 8.2 Sources & References
- 8.3 List of Tables & Figures
- 8.4 Primary Insights
- 8.5 Data Pack
- 8.6 Glossary of Terms
Have a question?


SELECT AN OPTION
Have a question?
Questions? Please give us a call or visit the contact form.