
Need help finding what you are looking for?
Contact Us
PUBLISHER: Mordor Intelligence | PRODUCT CODE: 1693886

PUBLISHER: Mordor Intelligence | PRODUCT CODE: 1693886
Non-dairy Yogurt - Market Share Analysis, Industry Trends & Statistics, Growth Forecasts (2025 - 2030)
PUBLISHED:
PAGES: 251 Pages
DELIVERY TIME: 2-3 business days
SELECT AN OPTION
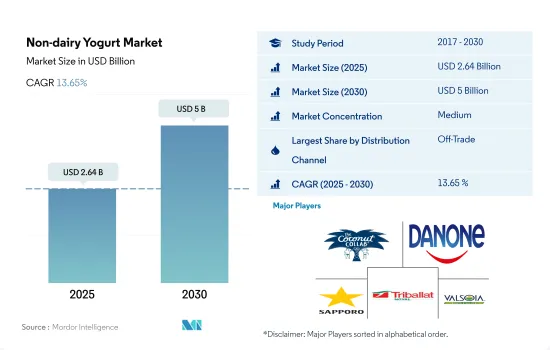
The Non-dairy Yogurt Market size is estimated at 2.64 billion USD in 2025, and is expected to reach 5 billion USD by 2030, growing at a CAGR of 13.65% during the forecast period (2025-2030).
Availability of multiple brands coupled with promotional offers is likely to boost the online retail medium during the forecast period
- Global off-trade retailing dominated the overall retail space during the review period (2017-2022). In 2022, it was observed that consumer satisfaction was the major factor associated with these retailers. Consumers are highly fascinated by off-trade retailing due to the greater convenience and comfort they get during purchasing non-dairy yogurt. The global distribution channel has observed a growth of 6.84% from 2021.
- By region, Asia-Pacific is marked as the largest, holding a share of 48.73% in the overall off-trade distribution channels. In the Asia-Pacific region, off-trade channels offer non-dairy yogurt at varied prices (low, medium, and high). The price ranges from USD 2.55 to USD 16.4. The availability of non-dairy yogurt at varied prices also promotes the buying power among consumers as they can purchase the products that suit their affordability parameters.
- On-trade retailers focus on providing a variety of non-dairy yogurt, including different flavors such as unsweetened, chocolate, and vanilla. Despite offering different flavors, these retailers cannot provide complete information, such as product specifics (ingredient used, seed used, and others), to consumers. Consumers are engaged in purchasing non-dairy yogurt through off-trade modes. In 2022, Europe was considered the fastest-growing region for on-trade channels, as it held a share of 7.41%.
- Between 2018 and 2022, in off-trade channels, specialty stores gained significant demand as they offered higher visibility about the product to consumers. Considering the demand for non-dairy yogurt, the global distribution segment is expected to grow by 24.7% in 2025 from 2022.
The increasing prevalence of veganism in Europe and North America is fueling the market for non-dairy yogurt
- Global consumption of non-dairy yogurt grew by 82% from 2019 to 2022. Non-dairy yogurt has become a part of daily life across different countries. Europe and North America are the largest non-dairy yogurt consumers, globally, registering market volume shares of 73% and 20%, respectively, in 2022.
- The United Kingdom and France are identified as the region's major markets, collectively accounting for a 65.25% share of the overall non-dairy yogurt volume sales in 2022. The rapid spike in the country's population preferring plant-based food has bolstered the demand for vegan yogurt across the United Kingdom. Around 60% of UK consumers were interested in plant-based proteins in 2022. The UK government has set regulations restricting the products on grocery or retail shelves or any e-commerce store, promoting products or drinks high in salt, sugar, and fat or those less healthy in an open forum. This has influenced the population to opt for non-dairy yogurt as a healthy alternative to conventional yogurt.
- In North America, non-dairy yogurt sales are estimated to expand at a value of 4.50% during 2023-2026, reaching USD 40,103.14 million in 2026. Non-dairy yogurt is one of the largest consumed categories across the region, with fruit flavors being the most popular in key countries such as the United States and Canada. As of 2021, 62% or 79 million households in the United States, bought plant-based products. This is an increase from 61% or 77 million in 2020.
- Asia-Pacific is identified as the fastest-growing non-dairy yogurt market, with anticipated value growth of 64% during 2024-2027. The market growth can be attributed to the rising consumer awareness about the nutritional profile of non-dairy yogurt.
Global Non-dairy Yogurt Market Trends
The significant rise in the vegan population, the growing lactose intolerant population, and the availability of innovative plant-based yogurt options drive the consumption of non-dairy yogurt.
- The consumption of different types of dairy alternative products is rising globally owing to a significant rise in the vegan population and the growing lactose-intolerant population. Even vegan exhibitions/trade shows and music festivals are conducted in different countries. For example, Australia has the third-highest percentage of vegans per capita globally. As of 2022, the country had 2.5 million vegans and vegetarians.
- In 2021, plant-based yogurt retail sales in the United States increased by 9%, i.e., three times more than traditional yogurt, reaching a 4.5% market share. Plant-based yogurt unit sales grew rapidly from 54% to 170 million units in 2021. Companies are taking innovative approaches to develop appetizing plant-based yogurts and introducing new flavors and combinations to meet the requirements of their vegan consumer base. Non-dairy yogurt consumption is anticipated to increase due to awareness about the advantages of plant-based foods in the market.
- Germany, France, and Italy have the highest per capita consumption of non-dairy yogurt. The growing popularity of dairy alternatives, primarily in Germany, has led to the rapid growth of plant-based yogurt. The demand for vegan yogurt is growing within the country, and domestic consumers, along with international consumers, are adopting veganism.
Non-dairy Yogurt Industry Overview
The Non-dairy Yogurt Market is moderately consolidated, with the top five companies occupying 59.16%. The major players in this market are Coconut Collaborative Ltd, Danone SA, Sapporo Holdings Ltd (POKKA SAPPORO Food & Beverage Ltd), Triballat Noyal SAS and Valsoia SpA (sorted alphabetically).
Additional Benefits:
- The market estimate (ME) sheet in Excel format
- 3 months of analyst support
Product Code: 50000757
TABLE OF CONTENTS
1 EXECUTIVE SUMMARY & KEY FINDINGS
2 REPORT OFFERS
3 INTRODUCTION
- 3.1 Study Assumptions & Market Definition
- 3.2 Scope of the Study
- 3.3 Research Methodology
4 KEY INDUSTRY TRENDS
- 4.1 Per Capita Consumption
- 4.2 Raw Material/commodity Production
- 4.2.1 Dairy Alternative - Raw Material Production
- 4.3 Regulatory Framework
- 4.3.1 Canada
- 4.3.2 France
- 4.3.3 Germany
- 4.3.4 Italy
- 4.3.5 Mexico
- 4.3.6 Spain
- 4.3.7 United Kingdom
- 4.3.8 United States
- 4.4 Value Chain & Distribution Channel Analysis
5 MARKET SEGMENTATION (includes market size in Value in USD and Volume, Forecasts up to 2030 and analysis of growth prospects)
- 5.1 Distribution Channel
- 5.1.1 Off-Trade
- 5.1.1.1 Convenience Stores
- 5.1.1.2 Online Retail
- 5.1.1.3 Specialist Retailers
- 5.1.1.4 Supermarkets and Hypermarkets
- 5.1.1.5 Others (Warehouse clubs, gas stations, etc.)
- 5.1.1 Off-Trade
- 5.2 Region
- 5.2.1 Africa
- 5.2.1.1 By Distribution Channel
- 5.2.1.2 South Africa
- 5.2.2 Asia-Pacific
- 5.2.2.1 By Distribution Channel
- 5.2.2.2 Australia
- 5.2.2.3 Japan
- 5.2.2.4 New Zealand
- 5.2.2.5 Rest of Asia Pacific
- 5.2.3 Europe
- 5.2.3.1 By Distribution Channel
- 5.2.3.2 Belgium
- 5.2.3.3 France
- 5.2.3.4 Germany
- 5.2.3.5 Italy
- 5.2.3.6 Netherlands
- 5.2.3.7 Russia
- 5.2.3.8 Spain
- 5.2.3.9 United Kingdom
- 5.2.3.10 Rest of Europe
- 5.2.4 Middle East
- 5.2.4.1 By Distribution Channel
- 5.2.4.2 Saudi Arabia
- 5.2.4.3 United Arab Emirates
- 5.2.5 North America
- 5.2.5.1 By Distribution Channel
- 5.2.5.2 Canada
- 5.2.5.3 United States
- 5.2.6 South America
- 5.2.6.1 By Distribution Channel
- 5.2.6.2 Brazil
- 5.2.1 Africa
6 COMPETITIVE LANDSCAPE
- 6.1 Key Strategic Moves
- 6.2 Market Share Analysis
- 6.3 Company Landscape
- 6.4 Company Profiles (includes Global Level Overview, Market Level Overview, Core Business Segments, Financials, Headcount, Key Information, Market Rank, Market Share, Products and Services, and Analysis of Recent Developments).
- 6.4.1 Blue Diamond Growers
- 6.4.2 Califia Farms LLC
- 6.4.3 Coconut Collaborative Ltd
- 6.4.4 Danone SA
- 6.4.5 Oatly Group AB
- 6.4.6 Sapporo Holdings Ltd (POKKA SAPPORO Food & Beverage Ltd)
- 6.4.7 Triballat Noyal SAS
- 6.4.8 Valsoia SpA
7 KEY STRATEGIC QUESTIONS FOR DAIRY AND DAIRY ALTERNATIVE CEOS
8 APPENDIX
- 8.1 Global Overview
- 8.1.1 Overview
- 8.1.2 Porter's Five Forces Framework
- 8.1.3 Global Value Chain Analysis
- 8.1.4 Market Dynamics (DROs)
- 8.2 Sources & References
- 8.3 List of Tables & Figures
- 8.4 Primary Insights
- 8.5 Data Pack
- 8.6 Glossary of Terms
Have a question?


SELECT AN OPTION
Have a question?
Questions? Please give us a call or visit the contact form.