
Need help finding what you are looking for?
Contact Us
PUBLISHER: Mordor Intelligence | PRODUCT CODE: 1693616

PUBLISHER: Mordor Intelligence | PRODUCT CODE: 1693616
North America Electric Bus - Market Share Analysis, Industry Trends & Statistics, Growth Forecasts (2025 - 2030)
PUBLISHED:
PAGES: 200 Pages
DELIVERY TIME: 2-3 business days
SELECT AN OPTION
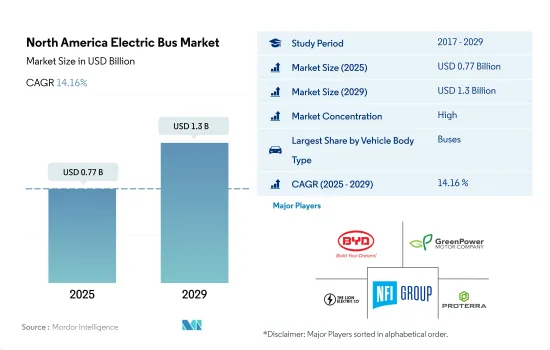
The North America Electric Bus Market size is estimated at 0.77 billion USD in 2025, and is expected to reach 1.3 billion USD by 2029, growing at a CAGR of 14.16% during the forecast period (2025-2029).
Environmental concerns and the need to reduce carbon emissions have pushed governments and transportation authorities to adopt cleaner and more sustainable modes of transportation
- The demand for electric buses in North America is growing significantly. The United States is one of the top countries with the highest sales of electric buses, followed by Canada and Mexico. Factors such as expanding populations, rising traffic, and a change in priorities for using public transit are contributing to the growth of electric buses in the region.
- The electric bus market faced a setback during the COVID-19 pandemic, which brought the transportation sector to a standstill. However, as the region emerged from the pandemic, there was a notable uptick in public transportation demand, positively impacting the electric bus market. Consequently, North America saw a rise in electric bus sales in 2022 compared to 2021.
- By 2027, the market value of electric buses in North America is projected to exceed USD 850 million. Both the United States and Canadian governments are devising plans to establish robust charging infrastructure across the region. In June 2021, the Federal Transit Administration (FTA), a division of the US Department of Transportation, awarded approximately USD 182 million. These funds are expected to benefit around 49 electric bus projects spanning 46 states. Through its Low-No Program, the FTA aims to facilitate the adoption of green technologies and fuels, assisting transportation organizations in procuring electric and hydrogen buses. These initiatives are poised to further propel the growth of the North American electric bus market in the future.
North America Electric Bus Market Trends
Growing demand for electric vehicles in North America driven by government support and growing environmental concerns
- The CVP in Russia has experienced significant fluctuations in recent years. It climbed steadily from USD 208.2 million in 2017, peaking in 2019. However, it dipped to USD 193.9 million in 2020, largely due to the economic challenges brought on by the COVID-19 pandemic. Notably, the market rebounded sharply in 2022, reaching USD 269.8 million. This resurgence highlights both the resilience of the Russian automotive sector and the potential impact of economic stimulus measures and heightened consumer demand.
- Government incentives and subsidies are proving to be a strong draw for customers, particularly logistics and e-commerce firms, in their adoption of electric commercial vehicles. A case in point is Canada and North America, where, in April 2022, the government unveiled federal rebates of USD 5000 for electric light- and medium-duty vehicles. These initiatives are expected to significantly bolster the demand for electric commercial vehicles in North America from 2024 to 2030.
- Government initiatives, including plans for EV deployment, attractive incentives, and foreign investment allowances, are set to propel the electric vehicle market across North American nations. In a notable move, in March 2022, Volkswagen committed a staggering USD 7 billion to establish an electric car manufacturing facility in North America. By 2030, the automaker plans to roll out 25 new EV models, catering to customers in the US, Mexico, and Canada. As a result, the demand for electric vehicles is projected to witness a notable surge across various North American countries from 2024 to 2030.
North America Electric Bus Industry Overview
The North America Electric Bus Market is fairly consolidated, with the top five companies occupying 81.84%. The major players in this market are BYD Auto Co. Ltd., GreenPower Motor Company Inc., Lion Electric Company, NFI Group Inc. and Proterra INC. (sorted alphabetically).
Additional Benefits:
- The market estimate (ME) sheet in Excel format
- 3 months of analyst support
Product Code: 93000
TABLE OF CONTENTS
1 EXECUTIVE SUMMARY & KEY FINDINGS
2 REPORT OFFERS
3 INTRODUCTION
- 3.1 Study Assumptions & Market Definition
- 3.2 Scope of the Study
- 3.3 Research Methodology
4 KEY INDUSTRY TRENDS
- 4.1 Population
- 4.2 GDP Per Capita
- 4.3 Consumer Spending For Vehicle Purchase (cvp)
- 4.4 Inflation
- 4.5 Interest Rate For Auto Loans
- 4.6 Shared Rides
- 4.7 Impact Of Electrification
- 4.8 EV Charging Station
- 4.9 Battery Pack Price
- 4.10 New Xev Models Announced
- 4.11 Fuel Price
- 4.12 Oem-wise Production Statistics
- 4.13 Regulatory Framework
- 4.14 Value Chain & Distribution Channel Analysis
5 MARKET SEGMENTATION (includes market size in Value in USD and Volume, Forecasts up to 2029 and analysis of growth prospects)
- 5.1 Fuel Category
- 5.1.1 BEV
- 5.1.2 FCEV
- 5.1.3 HEV
- 5.2 Country
- 5.2.1 Canada
- 5.2.2 Mexico
- 5.2.3 US
6 COMPETITIVE LANDSCAPE
- 6.1 Key Strategic Moves
- 6.2 Market Share Analysis
- 6.3 Company Landscape
- 6.4 Company Profiles
- 6.4.1 Blue Bird Corporation
- 6.4.2 BYD Auto Co. Ltd.
- 6.4.3 CAF Group (Solaris Bus & Coach)
- 6.4.4 Daimler Truck Holding AG
- 6.4.5 GILLIG LLC
- 6.4.6 GreenPower Motor Company Inc.
- 6.4.7 Lion Electric Company
- 6.4.8 NFI Group Inc.
- 6.4.9 Proterra INC.
- 6.4.10 Volvo Group
- 6.4.11 Xiamen King Long Motor Group Co. Ltd.
7 KEY STRATEGIC QUESTIONS FOR VEHICLES CEOS
8 APPENDIX
- 8.1 Global Overview
- 8.1.1 Overview
- 8.1.2 Porter's Five Forces Framework
- 8.1.3 Global Value Chain Analysis
- 8.1.4 Market Dynamics (DROs)
- 8.2 Sources & References
- 8.3 List of Tables & Figures
- 8.4 Primary Insights
- 8.5 Data Pack
- 8.6 Glossary of Terms
Have a question?


SELECT AN OPTION
Have a question?
Questions? Please give us a call or visit the contact form.