
PUBLISHER: Mordor Intelligence | PRODUCT CODE: 1836641

PUBLISHER: Mordor Intelligence | PRODUCT CODE: 1836641
Commercial Real Estate - Market Share Analysis, Industry Trends & Statistics, Growth Forecasts (2025 - 2030)
The global commercial real estate market holds a value of USD 6.22 trillion in 2025 and is forecast to reach USD 8.29 trillion by 2030, registering a 5.91% CAGR during the period.
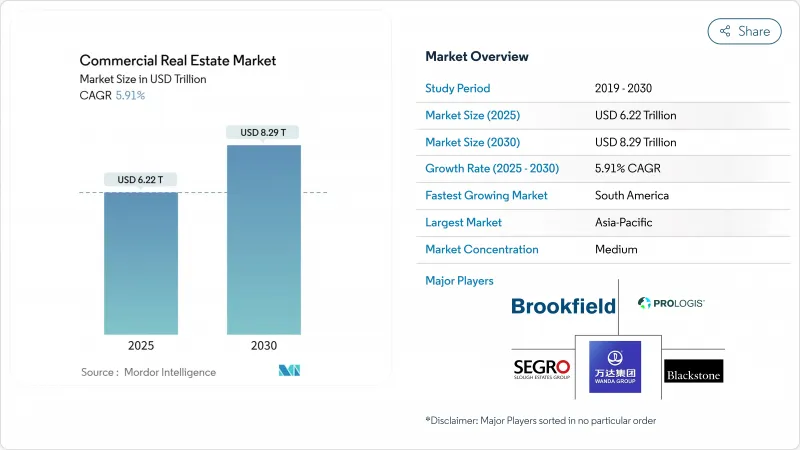
This growth reflects the rising convergence of property investment with technology infrastructure, especially data-center and logistics assets that support digital commerce. Capital keeps flowing from sovereign wealth and pension funds-over USD 180 billion each year-into income-producing buildings as investors rotate away from volatile equities. Demand remains buoyant for mixed-use communities, transit-served sites, and ESG-ready facilities that balance resilience with sustainability. Structural headwinds such as hybrid work patterns, construction-cost inflation, and insurance premiums tied to climate risk are encouraging adaptive-reuse projects and smarter asset-management technology, making the commercial real estate market more efficient and transparent.
Global Commercial Real Estate Market Trends and Insights
Logistics-Led Demand Spike From Omnichannel Retail
E-commerce fulfillment strategies now center on last-mile facilities within population clusters, raising premiums on Class A warehouses. Amazon's 143-acre Fort Myers land purchase underscores this logistics expansion. Retailers such as Sam's Club, which plans 15 new stores yearly while overhauling 600 sites, blend physical and digital channels, magnifying the need for hybrid distribution hubs. Australian warehouse rents climbed 5% year-on-year in Q1 2025 amid 2.3 million m2 of supply under construction. Automation-ready and energy-efficient buildings therefore command higher valuations, sustaining momentum in the commercial real estate market. Emerging ESG mandates further favor assets with rooftop solar and EV-charging infrastructure.
Flight-to-Quality Upgrading of Prime CBD Offices
Corporations increasingly prefer amenities-rich Grade A locations to engage hybrid staff, driving Tokyo office rents higher for five straight quarters in 2025. While premium towers tighten, secondary offices face vacancies, prompting city-backed conversion programs: San Francisco approved legislation to transform empty buildings into 4,400 housing units. Such adaptive reuse raises net operating income, evidenced by New Haven's Palladium Building, whose NOI rose from USD 154,380 to USD 267,000 after conversion. Investors targeting stressed CBD stock can unlock value through repositioning, underpinning the commercial real estate market's resilience despite hybrid-work friction.
Persistent Hybrid-Work Dampening Global Office Absorption
Forty percent of knowledge employees remained fully or partly remote in 2024, muting net new leasing. Goldman Sachs projects materially higher vacancies by 2030. Downtown Seattle's comeback is fragile, underscoring foot-traffic shortfalls that weigh on urban revenues. Portland's valuation slump produced a USD 92.8 million municipal budget gap. Banks extend loans to avoid write-downs, with Fed researchers flagging 4.8-5.3% originations decline since 2022. Conversions to housing provide relief, though each unit in Los Angeles can cost USD 240,000 to deliver.
Other drivers and restraints analyzed in the detailed report include:
- Sovereign & Pension-Fund Pivot Toward Income-Producing CRE
- Rapid Hyperscale & Edge Data-Center Campus Roll-Outs
- Construction-Material & Financing-Cost Inflation Squeezing Yields
For complete list of drivers and restraints, kindly check the Table Of Contents.
Segment Analysis
The offices segment held commercial real estate market share of 34% in 2024. Logistics and industrial assets are forecast to grow at a 6.21% CAGR. Amazon's plan to power Oregon data centers with advanced nuclear technology underscores a convergence of logistics and energy infrastructure. Store-closure headwinds weigh on traditional retail, yet experiential formats and omnichannel pickup points open reuse pathways. Hotels rebound alongside tourism, while data centers crystalize into a high-power sub-class within commercial real estate market size metrics.
Mixed-use projects protect cash flow by layering residential, retail and workspace. Georgetown's USD 16.5 million mill conversion into riverfront apartments plus retail illustrates value-add potential. Tokyo's BLUE FRONT SHIBAURA twin towers reinforce premium for multi-purpose destinations. Industrial landlords embed solar and EV infrastructure to meet tenant ESG targets, strengthening resilience and positioning for higher rents inside the commercial real estate market.
The Commercial Real Estate Market Size Report is Segmented by Property Type (Offices, Retail, Logistics and More), by Business Model (Sales, Rental), by End-User (Individuals / Households, Corporates & SMEs and More) and by Region (North America, South America, Europe, Asia-Pacific & Middle East and Africa). The Market Forecasts are Provided in Terms of Value (USD).
Geography Analysis
Asia-Pacific retained 32% of 2024 revenue, supported by urbanization and near-shoring. Tokyo's Grade A rents rose for five consecutive quarters, and prime logistics equities posted 10.1% stock gains in Q1 2025. CBRE's 2025 investor survey shows half of respondents plan heavier exposure to Australia, Korea, Singapore, Hong Kong and especially Tokyo. Chinese consumer caution tempers discretionary retail; nonetheless, Chengdu and Hangzhou's upgraded status spur new mall and office starts. Australia's warehouse premium-rent trajectory, at 5% year-on-year, underlines ongoing preference for automation-ready sheds.
South America hosts the fastest 6.26% CAGR through 2030, buoyed by infrastructure and commodity cycles. Mexico captured record USD 36 billion FDI in 2023 on supply-chain relocation, lifting industrial pre-leases near the United States. Brazil's 2025 GDP is set for 2.4% growth, and social-commerce uptake via TikTok Shop requires extra fulfillment square footage. Cancun's 14% house-price climb and 30% luxury-condo demand increase by 2027 mirror tourism-led appetite for mixed-use schemes. Argentina's macro stabilization and Peru's USD 3.6 billion port upgrades extend the industrial corridor, expanding commercial real estate market size for logistics developers.
Europe presents mixed signals. Germany's residential-investment market is rebounding, while Austria saw prime rents break EUR 20/m2 in three states due to undersupply. Private-equity outlook brightens across software and pharma clusters, improving real-estate exit timelines. France anticipates steadier 2025 volumes as logistics assets regain investor favor, though older offices still languish. Middle-East diversification injects capital into African and European portfolios: Saudi Arabia permitted foreign stakes in sacred-city REITs and Egypt green-lit a USD 1 billion hydrogen-powered skyscraper. Tokenized Dubai deals illustrate how fintech can redraw capital flows inside the commercial real estate market.
- Brookfield Asset Management
- Prologis Inc.
- Blackstone Real Estate (BREIT & BPP)
- Simon Property Group
- Link REIT
- Segro Plc
- Mitsubishi Estate Co.
- Unibail-Rodamco-Westfield
- Vonovia SE
- Gecina SA
- Boston Properties Inc.
- Alexandria Real Estate Equities
- Dexus
- Goodman Group
- China Vanke Co. (Commercial)
- Wanda Group
- CapitaLand Investment
- Mapletree Investments
- Ascendas REIT
- CBRE Group
- JLL
- Cushman & Wakefield
- Colliers International
- Knight Frank
Additional Benefits:
- The market estimate (ME) sheet in Excel format
- 3 months of analyst support
TABLE OF CONTENTS
1 Introduction
- 1.1 Study Assumptions & Market Definition
- 1.2 Scope of the Study
2 Research Methodology
3 Executive Summary
4 Market Landscape
- 4.1 Market Overview
- 4.2 Commercial RE Buying Trends - Socio-Economic & Demographic Insights
- 4.3 Rental Yield Analysis
- 4.4 Capital-Market Penetration & REIT Presence
- 4.5 Regulatory Outlook
- 4.6 Technological Outlook
- 4.7 Insights into Real-Estate Tech & Start-ups Active in the Segment
- 4.8 Insights into Existing & Upcoming Projects
- 4.9 Market Drivers
- 4.9.1 Logistics-led demand spike from omnichannel retail
- 4.9.2 Flight-to-quality upgrading of prime CBD offices
- 4.9.3 Sovereign & pension-fund pivot toward income-producing CRE
- 4.9.4 Rapid hyperscale & edge data-centre campus roll-outs
- 4.9.5 Transit-oriented rezoning lifting mixed-use land values
- 4.9.6 Generative-AI-driven site-selection boosting secondary markets
- 4.10 Market Restraints
- 4.10.1 Persistent hybrid-work dampening global office absorption
- 4.10.2 Construction-material & financing-cost inflation squeezing yields
- 4.10.3 ESG-driven obsolescence risk for legacy assets
- 4.10.4 Heightened climate-insurance premia in coastal metros
- 4.11 Value / Supply-Chain Analysis
- 4.11.1 Overview
- 4.11.2 Developers & Constructors - Key Quantitative & Qualitative Insights
- 4.11.3 Brokers & Agents - Key Quantitative & Qualitative Insights
- 4.11.4 Property-Management Companies - Key Quantitative & Qualitative Insights
- 4.11.5 Valuation, Advisory & Other Services
- 4.11.6 Building-Materials Procurement & Strategic Partnerships
- 4.11.7 Profiles of Global Strategic Investors / Buyers
- 4.12 Porter's Five Forces
- 4.12.1 Bargaining Power of Suppliers
- 4.12.2 Bargaining Power of Buyers
- 4.12.3 Threat of New Entrants
- 4.12.4 Threat of Substitutes
- 4.12.5 Intensity of Competitive Rivalry
5 Market Size & Growth Forecasts (Value)
- 5.1 By Property Type
- 5.1.1 Offices
- 5.1.2 Retail
- 5.1.3 Logistics
- 5.1.4 Others (Industrial Parks, Hospitality, Mixed-Use)
- 5.2 By Business Model
- 5.2.1 Sales
- 5.2.2 Rental
- 5.3 By End-User
- 5.3.1 Individuals / Households
- 5.3.2 Corporates & SMEs
- 5.3.3 Others (Institutions, Government, NGOs)
- 5.4 By Region
- 5.4.1 North America
- 5.4.1.1 United States
- 5.4.1.2 Canada
- 5.4.1.3 Mexico
- 5.4.2 South America
- 5.4.2.1 Brazil
- 5.4.2.2 Argentina
- 5.4.2.3 Chile
- 5.4.2.4 Rest of South America
- 5.4.3 Europe
- 5.4.3.1 Germany
- 5.4.3.2 United Kingdom
- 5.4.3.3 France
- 5.4.3.4 Italy
- 5.4.3.5 Spain
- 5.4.3.6 Rest of Europe
- 5.4.4 Asia-Pacific
- 5.4.4.1 China
- 5.4.4.2 India
- 5.4.4.3 Japan
- 5.4.4.4 South Korea
- 5.4.4.5 Australia
- 5.4.4.6 Rest of Asia-Pacific
- 5.4.5 Middle East and Africa
- 5.4.5.1 United Arab Emirates
- 5.4.5.2 Saudi Arabia
- 5.4.5.3 South Africa
- 5.4.5.4 Nigeria
- 5.4.5.5 Rest of Middle East and Africa
- 5.4.1 North America
6 Competitive Landscape
- 6.1 Market Concentration
- 6.2 Strategic Moves
- 6.3 Market Share Analysis
- 6.4 Company Profiles {(includes Global-level Overview, Market-level Overview, Core Segments, Financials as available, Strategic Information, Market Rank/Share for key companies, Products & Services, and Recent Developments)}
- 6.4.1 Brookfield Asset Management
- 6.4.2 Prologis Inc.
- 6.4.3 Blackstone Real Estate (BREIT & BPP)
- 6.4.4 Simon Property Group
- 6.4.5 Link REIT
- 6.4.6 Segro Plc
- 6.4.7 Mitsubishi Estate Co.
- 6.4.8 Unibail-Rodamco-Westfield
- 6.4.9 Vonovia SE
- 6.4.10 Gecina SA
- 6.4.11 Boston Properties Inc.
- 6.4.12 Alexandria Real Estate Equities
- 6.4.13 Dexus
- 6.4.14 Goodman Group
- 6.4.15 China Vanke Co. (Commercial)
- 6.4.16 Wanda Group
- 6.4.17 CapitaLand Investment
- 6.4.18 Mapletree Investments
- 6.4.19 Ascendas REIT
- 6.4.20 CBRE Group
- 6.4.21 JLL
- 6.4.22 Cushman & Wakefield
- 6.4.23 Colliers International
- 6.4.24 Knight Frank
7 Market Opportunities & Future Outlook
- 7.1 White-Space & Unmet-Need Assessment

