
PUBLISHER: Mordor Intelligence | PRODUCT CODE: 1836704

PUBLISHER: Mordor Intelligence | PRODUCT CODE: 1836704
Medium And Heavy Duty Commercial Vehicles - Market Share Analysis, Industry Trends & Statistics, Growth Forecasts (2025 - 2030)
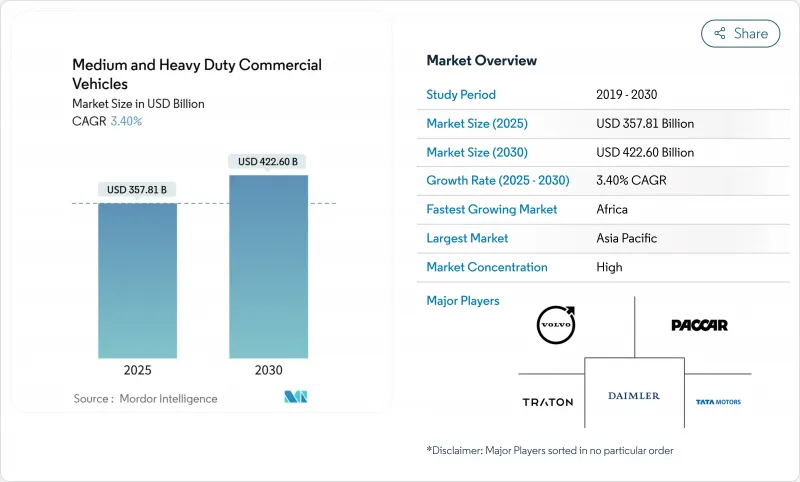
The Medium and Heavy Duty Commercial Vehicles Market size is estimated at USD 357.81 billion in 2025, and is expected to reach USD 422.60 billion by 2030, at a CAGR of 3.40% during the forecast period (2025-2030).
This measured expansion comes as fleets align with Euro VII in Europe and EPA 2027 in North America while modernizing infrastructure across Asia-Pacific, Latin America, and Africa. Regulatory convergence has tightened replacement cycles, yet internal combustion engines dominate sales, and battery-electric models are scaling from a small base. Growth is further reinforced by public-sector stimulus for road and logistics corridors, e-commerce demand for lighter trucks, and software-defined vehicle platforms that improve total cost of ownership and safety analytics.
Global Medium And Heavy Duty Commercial Vehicles Market Trends and Insights
Fleet Renewal Driven by Euro VII & EPA 2027 Emission Rules
Stringent NOx and CO2 targets accelerate the replacement of pre-Euro VI and older diesel units in Europe and compel North American fleets to refresh Class 6-8 inventories sooner than planned. Recently adopted Euro 7 standards impose stricter limits, especially for heavy-duty vehicles (HDVs). These standards reduce nitrogen oxides (NOX) limits by 50% to 62%, depending on the test cycle. Additionally, they replace the total hydrocarbon (THC) limits with distinct, more stringent limits for non-methane organic gases (NMOG) and methane (CH4). Coordinated timing compresses procurement into narrow windows that strain suppliers but unlock economies of scale for after-treatment and battery technologies. California's Advanced Clean Trucks regulation, covering 25% of the US market, mandates 50% zero-emission sales by 2030. Operators that adopt early benefit from incentive pools and residual-value premiums, whereas late movers face supply shortages and higher compliance costs. Manufacturers with existing electric portfolios enjoy a first-mover edge and can amortize development expenses across both regions.
Infrastructure Stimulus in Emerging Economies
Government-backed road and energy programs continue to lift medium and heavy commercial vehicles market demand in India, Indonesia, Malaysia, and key Latin American countries. India's FAME framework targets 70% electric commercial vehicle penetration by 2030, supporting 49% annual growth in electric truck sales and encouraging suppliers to localize battery modules and drivetrains. Similar multi-year road-building and electrification measures in Indonesia and Malaysia foster a regional scale. At the same time, the Inter-American Development Bank estimates that coordinated incentives could raise Latin America's share of global electric truck sales from 0.45% to 4% by 2030. These initiatives extend purchasing visibility beyond the normal seven-year replacement horizon, enabling component makers to secure capacity and de-risk capital investment. The combination of stimulus funds and local content rules underpins a steady pipeline of orders for chassis, cabs, and charging infrastructure suppliers.
High Upfront Cost of Zero-Emission Trucks
Battery packs account for 40% of unit cost, leaving electric heavy trucks priced 20-30% above diesel equivalents. Total cost parity is projected within four years as lithium-iron-phosphate chemistries scale, yet many small carriers lack financing headroom. Truck-as-a-service contracts and battery leasing can cut acquisition costs by up to 42% while helping manufacturers generate recurring revenue. Large fleet operators are already adopting these models, but credit-constrained buyers in emerging economies still face high hurdle rates that slow take-up.
Other drivers and restraints analyzed in the detailed report include:
- E-Commerce Logistics Expansion
- Telematics-Enabled Usage-Based Insurance Lowers TCO
- Supply-Chain Bottlenecks for Batteries
For complete list of drivers and restraints, kindly check the Table Of Contents.
Segment Analysis
The above-16-ton models contributed around 60.26% of 2024 medium and heavy commercial vehicles market share, securing the largest slice of the medium and heavy commercial vehicles market. Demand is anchored by long-haul freight networks that prioritize payload capacity over convenience when charging. In contrast, the 3.5-7.5 ton class of medium and heavy commercial vehicles is expanding at 7.81% CAGR, outpacing all other bands as urban delivery platforms proliferate. This segment benefits from lower battery requirements as packs of 100-200 kWh suffice for daily routes, reducing capital outlays and charging complexity. Meanwhile, medium-duty units in the 7.5-16-ton range see stable replacement linked to construction and municipal procurement cycles.
Battery size scales steeply with vehicle mass, with heavy haulers needing 500 kWh or more to meet duty-cycle expectations. That requirement inflates curb weight and infrastructure costs, slowing electrification relative to lighter classes. Regulators differentiate limits by gross vehicle weight, compelling manufacturers to balance after-treatment and zero-emission designs across engineering roadmaps. Despite the cost gap, several mining companies are piloting 150-ton electric dumpers that yield life-cycle savings once charging networks are in place.
Internal combustion engines retained 91.72% revenue in 2024 of medium and heavy commercial vehicles market share, cementing their lead in the medium and heavy commercial vehicles market. Yet battery-electric trucks are on a steep 9.83% CAGR trajectory to 2030, helped by subsidies, lower operating costs, and rapid urban-fleet adoption. Alternative fuels such as compressed natural gas and liquefied natural gas continue to serve regional niches where electric range or grid access remains problematic. Plug-in hybrids act as transitional solutions for operators who must combine range flexibility with zero-emission urban entry.
China accounted for over 80% of global electric heavy-truck sales in 2024, illustrating the influence of coordinated incentives and local supply chains. Fuel-cell electric prototypes are under test for long-haul corridors where battery mass hurts payload, with early pilots in Germany, South Korea, and the US. The propulsion mix will therefore remain heterogeneous through 2030, driven by total cost of ownership calculations, energy-price trajectories, and infrastructure rollouts.
The Medium and Heavy Commercial Vehicle Market Report is Segmented by Tonnage (3. 5 To 7. 5 T, 7. 5 To 16 T, and Above 16 T), Propulsion Type (IC Engine, Plug-In Hybrid Electric, Battery Electric, and More), Vehicle Type (Rigid Truck and More), End-User Industry (Logistics and Transportation, Construction and Mining, and More), and Geography. The Market Forecasts are Provided in Terms of Value (USD) and Volume (Units).
Geography Analysis
Asia-Pacific's 45.52% 2024 revenue share stems from China's production depth and India's expanding policy push. The region is expected to extend its lead by 2030 because original-equipment manufacturers co-locate battery plants, software centers, and component testing near their largest buyers. China alone supported over 90,000 electric heavy-truck registrations in 2024, with BYD and SAIC exporting kits to Hungary and Indonesia to diversify tariff exposure. India backs 14 state incentive programs, allowing Uttar Pradesh and Maharashtra to create city-level low-emission zones that favor 3.5-ton battery trucks.
North America and Europe represent mature yet lucrative markets where coordinated rules ensure technological harmonization. The EU aims for a 45% CO2 cut in heavy trucks by 2030, and Euro VII will take effect in 2029. California's Advanced Clean Trucks rule influences national purchase plans because 11 other states have adopted its roadmap, covering one quarter of the US Class 6-8 demand. Canada targets 35% zero-emission truck sales by 2030 and funds charging corridors on the Trans-Canada Highway. On the corporate side, Volvo and Daimler established a joint venture to create a common operating system, while PACCAR integrates in-house battery packs to shield itself from volatility.
Africa is gaining investment momentum despite modest starting volumes and is rapidly growing with a robust CAGR of 9.10%. Morocco and Egypt order electric buses that share components with medium-duty trucks, creating a nucleus for regional supply. Ethiopia has already exceeded its 2030 bus electrification target, illustrating the potential of aggregated procurement models. South Africa's EV White Paper sets a dual platform roadmap that combines fuel efficiency upgrades for existing diesels with incentives for fast-charge depots around mining belts. These initiatives point to latent demand that could translate into double-digit shipment growth once grid reliability improves.
- Daimler Truck AG
- Volvo Group
- Traton SE (MAN, Scania, Navistar)
- PACCAR Inc.
- Tata Motors Ltd.
- Hyundai Motor Co.
- CNHTC (Sinotruk)
- Dongfeng Motor Corp.
- FAW Group
- Renault Trucks
- Isuzu Motors Ltd.
- Hino Motors
- Ashok Leyland
- Iveco Group
- Kamaz PJSC
- Shacman (Shaanxi Auto)
- UD Trucks
- BYD Auto
- Nikola Corp.
Additional Benefits:
- The market estimate (ME) sheet in Excel format
- 3 months of analyst support
TABLE OF CONTENTS
1 Introduction
- 1.1 Study Assumptions & Market Definition
- 1.2 Scope of the Study
2 Research Methodology
3 Executive Summary
4 Market Landscape
- 4.1 Market Overview
- 4.2 Market Drivers
- 4.2.1 Fleet renewal driven by Euro-VII & EPA 2027 emission rules
- 4.2.2 Infrastructure stimulus in emerging economies
- 4.2.3 E-commerce logistics expansion
- 4.2.4 Mining sector's push for battery-electric haul trucks
- 4.2.5 Telematics-enabled usage-based insurance lowers TCO
- 4.2.6 Secondary-use Battery Leasing Models
- 4.3 Market Restraints
- 4.3.1 High upfront cost of zero-emission trucks
- 4.3.2 Supply-chain bottlenecks for power-electronics & batteries
- 4.3.3 Depot-level grid-capacity limitations
- 4.3.4 Skilled-Technician Shortage for HV-EV Drivetrains
- 4.4 Value / Supply-Chain Analysis
- 4.5 Regulatory Landscape
- 4.6 Technological Outlook
- 4.7 Porter's Five Forces Analysis
- 4.7.1 Threat of New Entrants
- 4.7.2 Bargaining Power of Buyers
- 4.7.3 Bargaining Power of Suppliers
- 4.7.4 Threat of Substitutes
- 4.7.5 Intensity of Competitive Rivalry
5 Market Size & Growth Forecasts (Value (USD) and Volume (Units))
- 5.1 By Tonnage
- 5.1.1 3.5 to 7.5 t
- 5.1.2 7.5 to 16 t
- 5.1.3 Above 16 t
- 5.2 By Propulsion Type
- 5.2.1 Internal-Combustion Engine (Diesel & Gasoline)
- 5.2.2 Battery Electric
- 5.2.3 Plug-in Hybrid Electric
- 5.2.4 Fuel-cell Electric
- 5.2.5 Alternative Fuels (CNG, LNG, Bio-fuel, LPG)
- 5.3 By Vehicle Type
- 5.3.1 Rigid Truck
- 5.3.2 Tractor-Trailer
- 5.3.3 Tipper / Dump Truck
- 5.3.4 Specialized & Vocational Trucks
- 5.4 By End-user Industry
- 5.4.1 Logistics & Transportation
- 5.4.2 Construction & Mining
- 5.4.3 Agriculture & Forestry
- 5.4.4 Utilities & Municipal Services
- 5.5 By Geography
- 5.5.1 North America
- 5.5.1.1 United States
- 5.5.1.2 Canada
- 5.5.1.3 Rest of North America
- 5.5.2 South America
- 5.5.2.1 Brazil
- 5.5.2.2 Argentina
- 5.5.2.3 Rest of South America
- 5.5.3 Europe
- 5.5.3.1 Germany
- 5.5.3.2 United Kingdom
- 5.5.3.3 France
- 5.5.3.4 Spain
- 5.5.3.5 Italy
- 5.5.3.6 Russia
- 5.5.3.7 Rest of Europe
- 5.5.4 Asia-Pacific
- 5.5.4.1 China
- 5.5.4.2 India
- 5.5.4.3 Japan
- 5.5.4.4 South Korea
- 5.5.4.5 Australia
- 5.5.4.6 Rest of Asia-Pacific
- 5.5.5 Middle East and Africa
- 5.5.5.1 United Arab Emirates
- 5.5.5.2 Saudi Arabia
- 5.5.5.3 Turkey
- 5.5.5.4 South Africa
- 5.5.5.5 Egypt
- 5.5.5.6 Rest of Middle East and Africa
- 5.5.1 North America
6 Competitive Landscape
- 6.1 Market Concentration
- 6.2 Strategic Moves
- 6.3 Market Share Analysis
- 6.4 Company Profiles (Includes Global Level Overview, Market Level Overview, Core Segments, Financials as Available, Strategic Information, Market Rank/Share for Key Companies, Products and Services, SWOT Analysis, and Recent Developments)
- 6.4.1 Daimler Truck AG
- 6.4.2 Volvo Group
- 6.4.3 Traton SE (MAN, Scania, Navistar)
- 6.4.4 PACCAR Inc.
- 6.4.5 Tata Motors Ltd.
- 6.4.6 Hyundai Motor Co.
- 6.4.7 CNHTC (Sinotruk)
- 6.4.8 Dongfeng Motor Corp.
- 6.4.9 FAW Group
- 6.4.10 Renault Trucks
- 6.4.11 Isuzu Motors Ltd.
- 6.4.12 Hino Motors
- 6.4.13 Ashok Leyland
- 6.4.14 Iveco Group
- 6.4.15 Kamaz PJSC
- 6.4.16 Shacman (Shaanxi Auto)
- 6.4.17 UD Trucks
- 6.4.18 BYD Auto
- 6.4.19 Nikola Corp.
7 Market Opportunities & Future Outlook
- 7.1 White-space & Unmet-need Assessment

