
PUBLISHER: Mordor Intelligence | PRODUCT CODE: 1842708

PUBLISHER: Mordor Intelligence | PRODUCT CODE: 1842708
India Private Equity - Market Share Analysis, Industry Trends & Statistics, Growth Forecasts (2025 - 2030)
The India private equity market stands at USD 84.5 billion in 2025 and is on track to swell to USD 232.7 billion by 2030, compounding at 18.22%CAGR annually.
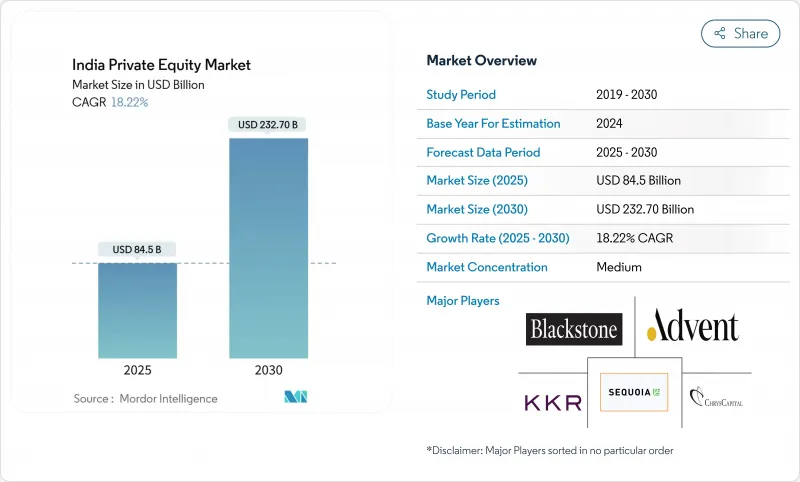
This expansion reflects the country's appeal as a capital destination that combines macroeconomic resilience, regulatory modernization, and deepening domestic liquidity. 2024 reforms under the Specialized Investment Fund (SIF) framework gave institutional investors a domestic on-ramp to private-market strategies and raised governance standards. Family-office participation has broadened the local investor base, while digitised deal-sourcing tools compress transaction timelines and level the playing field for emerging managers. Sector rotation into renewables, healthcare, and deep-tech adds a diversified pipeline of growth assets; meanwhile, a more stable rupee and tighter hedging regimes lower currency-related return erosion. Heightened competition among large global funds is encouraging value-creation expertise, partnership structures, and exit innovation, particularly GP-led secondaries, cementing India's position as a core allocation for global limited partners.
India Private Equity Market Trends and Insights
Digitization of Deal-Sourcing Platforms
Machine-learning engines now scrape filings, IP databases, and social platforms to surface hidden targets, enabling mid-market funds to triple their qualified-pipeline volume without proportional head-count expansion. Integrated virtual-data-room tools compress diligence to weeks, allowing GPs to table term-sheets ahead of slower rivals and lift win rates in competitive auctions. Platform APIs pipe real-time metrics straight to valuation models, which reduces mis-pricing risk and supports tighter bid spreads. For LPs, digital transparency lowers information asymmetry and makes fund selection more quantitative, driving a virtuous loop of capital re-allocation toward top-quartile managers. The dynamic also fuels co-investment syndication because deal snapshots can be broadcast instantly to LP dashboards. These efficiencies collectively enhance velocity inside the India private equity market, pushing throughput without sacrificing underwriting rigor.
Surge in Family-Office Capital Allocations
Average cheque sizes from Indian family offices rose from USD 8 million in 2022 to USD 13 million in 2024, reflecting rising comfort with direct control stakes. Many offices are now hiring ex-investment-bank teams, which upgrades diligence sophistication and positions them as credible lead investors rather than passive co-investors. Because these entities recycle domestic dividends, capital is stickier than foreign inflows and allows funds to navigate risk-off global cycles without pausing deployment. Direct participation also shortens fund-raising timelines; GPs routinely close 20-30% of a vehicle in a single anchor round backed by prominent families. A growing number of cross-border diaspora offices funnel capital through GIFT City AIFs in foreign currency, sidestepping rupee-volatility drag. As their governance expectations rise, they press managers for ESG dashboards and independent portfolio valuations, indirectly lifting industry standards across the India private equity market.
Uncertain Capital-Gains Tax Regime
The Budget 2025 proposal to classify all Category II AIF holdings as capital assets offers clarity yet lack of grandfathering forces funds to reassess legacy positions for potential retrospective exposure. Offshore sponsors remain apprehensive about GAAR override risk if treaty shopping is alleged, leading some to split structures between onshore feeders and offshore masters, which inflates administrative drag. Carry taxation is still silent on whether waterfall distributions could be treated as salary for resident managers, clouding personal-tax planning. Some LPs respond by embedding tax-gross-up clauses that push liability uncertainty onto GPs, complicating fund documents. The ambiguity drives scenario-based pricing models that shave 50-75 basis points off targeted net IRRs, tempering enthusiasm for fresh commitments. Until definitive circulars land, the India private equity market loses momentum at the margin relative to policy-stable peers.
Other drivers and restraints analyzed in the detailed report include:
- Government Push for Domestic AIF Structures
- Emergence of Deep-Tech and Climate-Tech Corridors
- Scarcity of Late-Stage IPO Windows
For complete list of drivers and restraints, kindly check the Table Of Contents.
Segment Analysis
Buyout pools captured a 32.20% slice of 2024 inflows as control deals unlock succession transitions in ageing promoter-led companies. Managers implement board-level talent refreshes, digitize ERP backbones and spin off non-core assets to lift EBITDA margins by 400-600 basis points within 24 months, validating the strategy's appeal to global pensions seeking operational alpha. Venture cheques continue but tilt toward later-stage Series C or beyond, reflecting a flight to proven unit economics after 2023's funding reset. Secondaries and fund-of-funds, clocking an 18.32% CAGR, give LPs shorter J-curves and risk diversification; insurers in particular favour them to match asset-liability durations. Distressed and mezzanine funds, while sub-scale, leverage improved Insolvency and Bankruptcy Code recoveries that average 32 cents on the dollar, feeding counter-cyclical performance and rounding out the India private equity industry product stack.
In parallel, regulatory easing allows Category III SIFs to employ long-short overlays on private book valuations, offering hedged exposure absent in conventional vehicles. Co-investment sidecars now accompany most flagship funds, giving LPs fee-efficient access to single-asset deals that exceed fund concentration limits. Family-office spin-offs, often staffed by ex-PE principals, launch micro-buyout vehicles focusing on niche manufacturing clusters, further fragmenting the landscape. These layers collectively broaden participation and cement the India private equity market as a multi-strategy platform capable of absorbing capital across risk spectra.
The India Private Equity Market is Segmented by Fund Type (Buyout and Growth, Venture Capital, Mezzanine and Distressed, and More), Sector (Technology, Healthcare, Real Estate, Financial Services, Consumer and Retail, Industrials, Telecom, and More), Investments (Large Cap, Upper-Middle Market, and More), and Region (North, West, South, East and Northeast, and Central). The Market Forecasts are Provided in Terms of Value (USD).
List of Companies Covered in this Report:
- ICICI Venture
- ChrysCapital
- Sequoia Capital India
- Ascent Capital
- Blackstone Group
- TPG
- KKR
- Baring Private Equity Partners
- True North
- Advent International
- Warburg Pincus
- Carlyle India
- Temasek
- GIC
- SoftBank Vision Fund
- Lightspeed India
- Accel India
- Nexus Venture Partners
- Omidyar Network India
- Elevation Capital
Additional Benefits:
- The market estimate (ME) sheet in Excel format
- 3 months of analyst support
TABLE OF CONTENTS
1 Introduction
- 1.1 Study Assumptions & Market Definition
- 1.2 Scope of the Study
2 Research Methodology
3 Executive Summary
4 Market Landscape
- 4.1 Market Overview
- 4.2 Market Drivers
- 4.2.1 Digitisation of deal-sourcing platforms
- 4.2.2 Surge in family-office capital allocations
- 4.2.3 Government push for domestic AIF structures
- 4.2.4 Emergence of deep-tech & climate-tech corridors
- 4.2.5 Mainstream adoption of GP-led secondary funds
- 4.2.6 Private credit replacing bridge rounds
- 4.3 Market Restraints
- 4.3.1 Uncertain capital-gains tax regime
- 4.3.2 Scarcity of late-stage IPO windows
- 4.3.3 Currency-hedging costs for offshore LPs
- 4.3.4 Stewardship & ESG-related litigations
- 4.4 Value / Supply-Chain Analysis
- 4.5 Regulatory Landscape
- 4.6 Technological Outlook
- 4.7 Porter's Five Forces
- 4.7.1 Threat of New Entrants
- 4.7.2 Bargaining Power of Portfolio Companies
- 4.7.3 Bargaining Power of Capital Providers
- 4.7.4 Threat of Substitute Financing
- 4.7.5 Intensity of Competitive Rivalry
5 Market Size & Growth Forecasts
- 5.1 By Fund Type
- 5.1.1 Buyout & Growth
- 5.1.2 Venture Capital
- 5.1.3 Mezzanine & Distressed
- 5.1.4 Secondaries & Fund of Funds
- 5.2 By Sector
- 5.2.1 Technology (Software)
- 5.2.2 Healthcare
- 5.2.3 Real Estate and Services
- 5.2.4 Financial Services
- 5.2.5 Industrials
- 5.2.6 Consumer & Retail
- 5.2.7 Energy & Power
- 5.2.8 Media & Entertainment
- 5.2.9 Telecom
- 5.2.10 Others (Transportation, etc.)
- 5.3 By Investments
- 5.3.1 Large Cap
- 5.3.2 Upper Middle Market
- 5.3.3 Lower Middle Market
- 5.3.4 Small & SMID
- 5.4 By Region
- 5.4.1 North India
- 5.4.2 West India
- 5.4.3 South India
- 5.4.4 East & Northeast India
- 5.4.5 Central India
6 Competitive Landscape
- 6.1 Market Concentration
- 6.2 Strategic Moves
- 6.3 Market Share Analysis
- 6.4 Company Profiles (includes Global level Overview, Market level Overview, Core Segments, Financials as available, Strategic Information, Market Rank/Share, Products & Services, Recent Developments)
- 6.4.1 ICICI Venture
- 6.4.2 ChrysCapital
- 6.4.3 Sequoia Capital India
- 6.4.4 Ascent Capital
- 6.4.5 Blackstone Group
- 6.4.6 TPG
- 6.4.7 KKR
- 6.4.8 Baring Private Equity Partners
- 6.4.9 True North
- 6.4.10 Advent International
- 6.4.11 Warburg Pincus
- 6.4.12 Carlyle India
- 6.4.13 Temasek
- 6.4.14 GIC
- 6.4.15 SoftBank Vision Fund
- 6.4.16 Lightspeed India
- 6.4.17 Accel India
- 6.4.18 Nexus Venture Partners
- 6.4.19 Omidyar Network India
- 6.4.20 Elevation Capital
7 Market Opportunities & Future Outlook
- 7.1 White-space & Unmet-need Assessment

